
Coming soon. Surface is being tested in the desktop terminal and is not on the web yet. There is no release date; this chapter shows what it does and how to read it, so you are ready when it arrives.
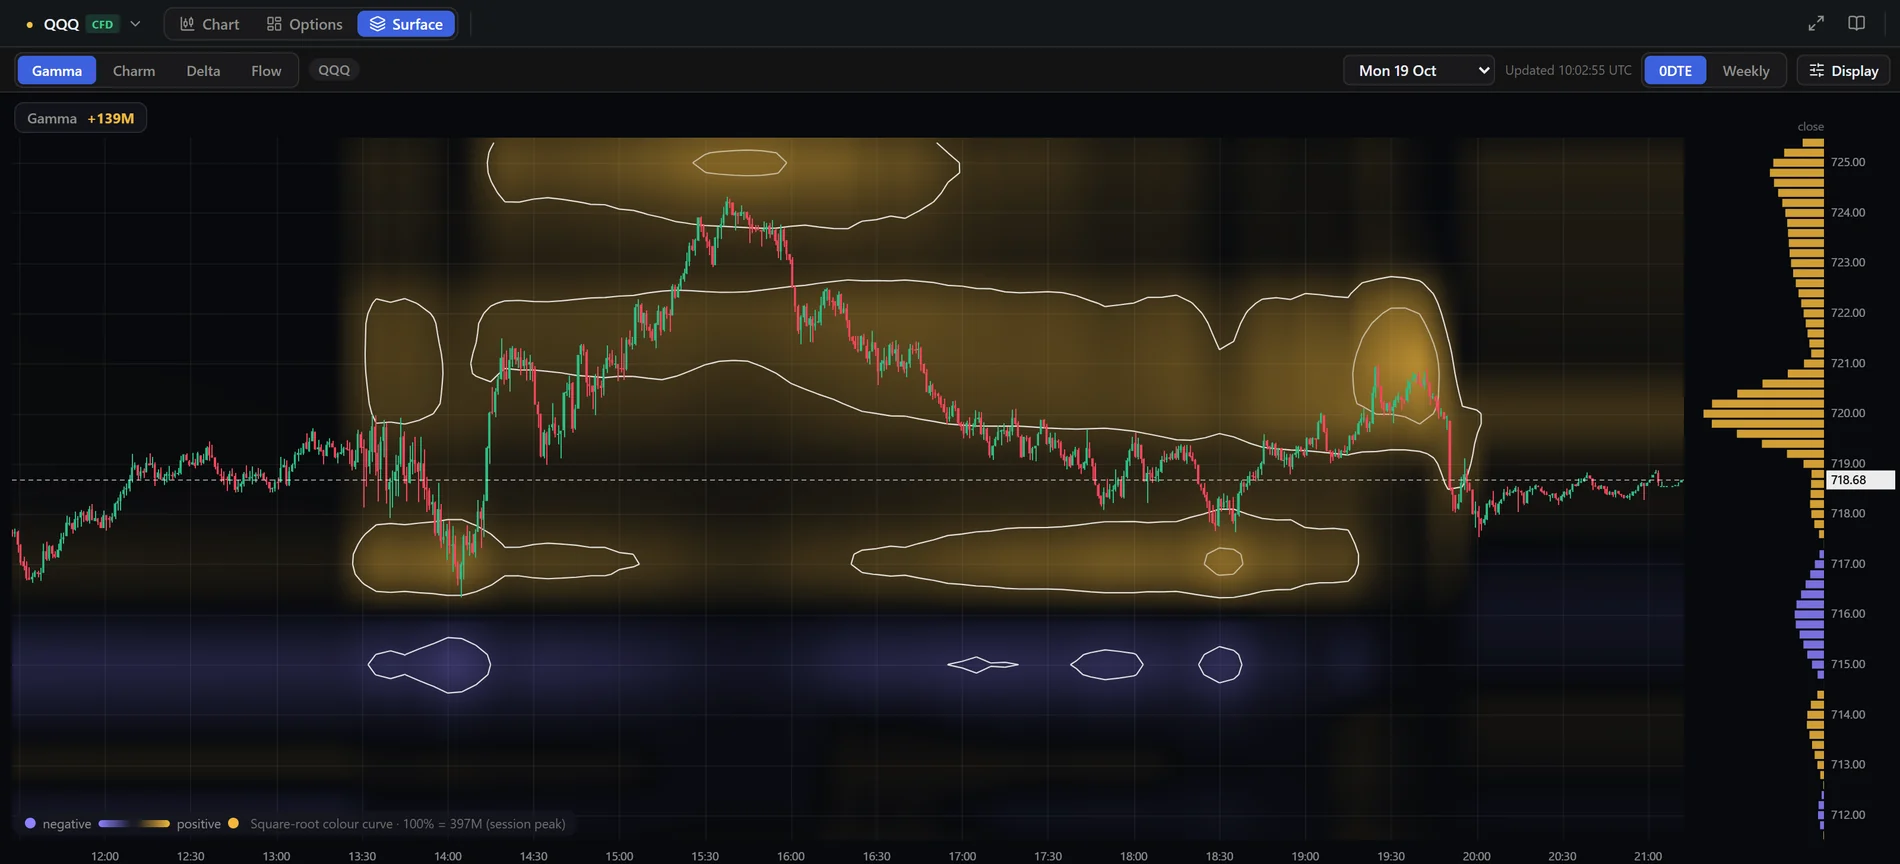
The GEX heatmap shows the walls on your candles. Surface gives the same positioning its own canvas: time across, strike up, one session at a time, with a layer for gamma, charm, delta and — separately — the real options money that traded. It answers where the pressure was, when it built, and how price behaved around it.
How to read the map
- Horizontal = time through the session; vertical = strike. Each column is a snapshot (about every five minutes).
- Colour = sign of the exposure (gold positive, purple negative); brightness = size relative to the session peak. The legend at the bottom shows what 100% means.
- White outlines mark the zones above a share of the peak (the “walls”); an inner outline marks the core.
- Candles (1-minute) are drawn over the map. Hover a cell for the exact strike, time and value — the tooltip tells you whether the number is real or interpolated between listed strikes.
- The bars on the right are the profile of the last snapshot, each scaled to its own maximum.
Four layers
- Gamma — the dealer-hedging model by strike. A gold pocket means dealers hedge against the move (price tends to be pulled back); a purple pocket means they hedge with it (moves tend to extend).
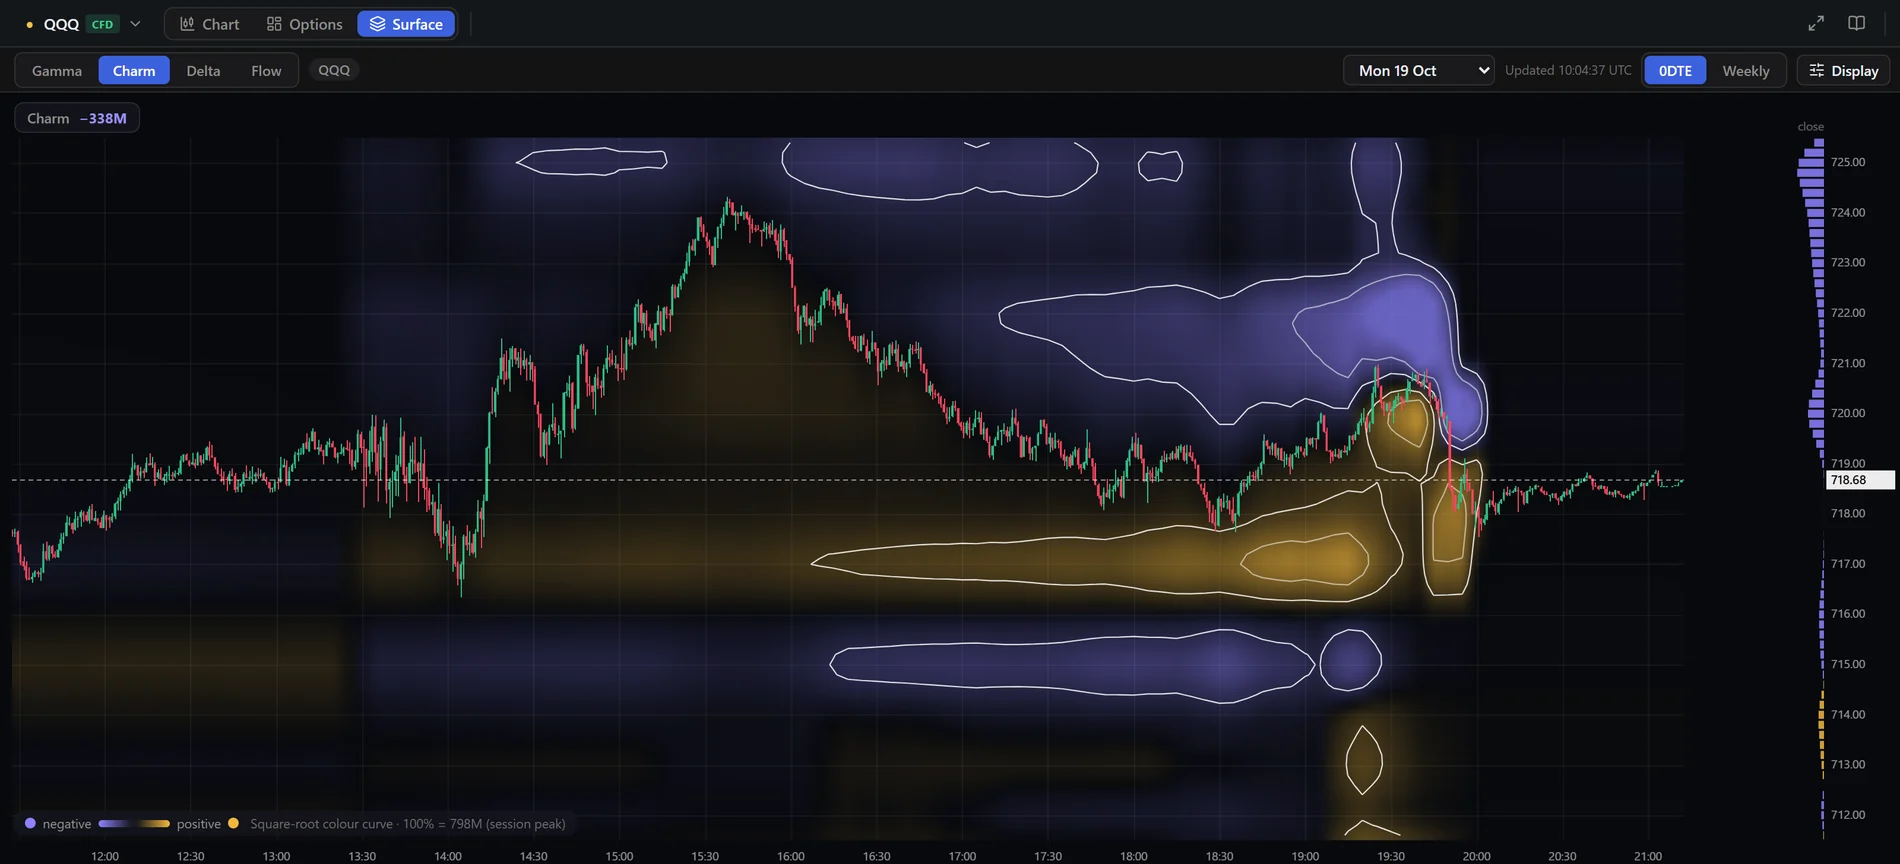
- Charm — how that hedging changes as time passes. It matters most late in the day, when charm builds quickly toward the close.
- Delta — net delta exposure by strike.
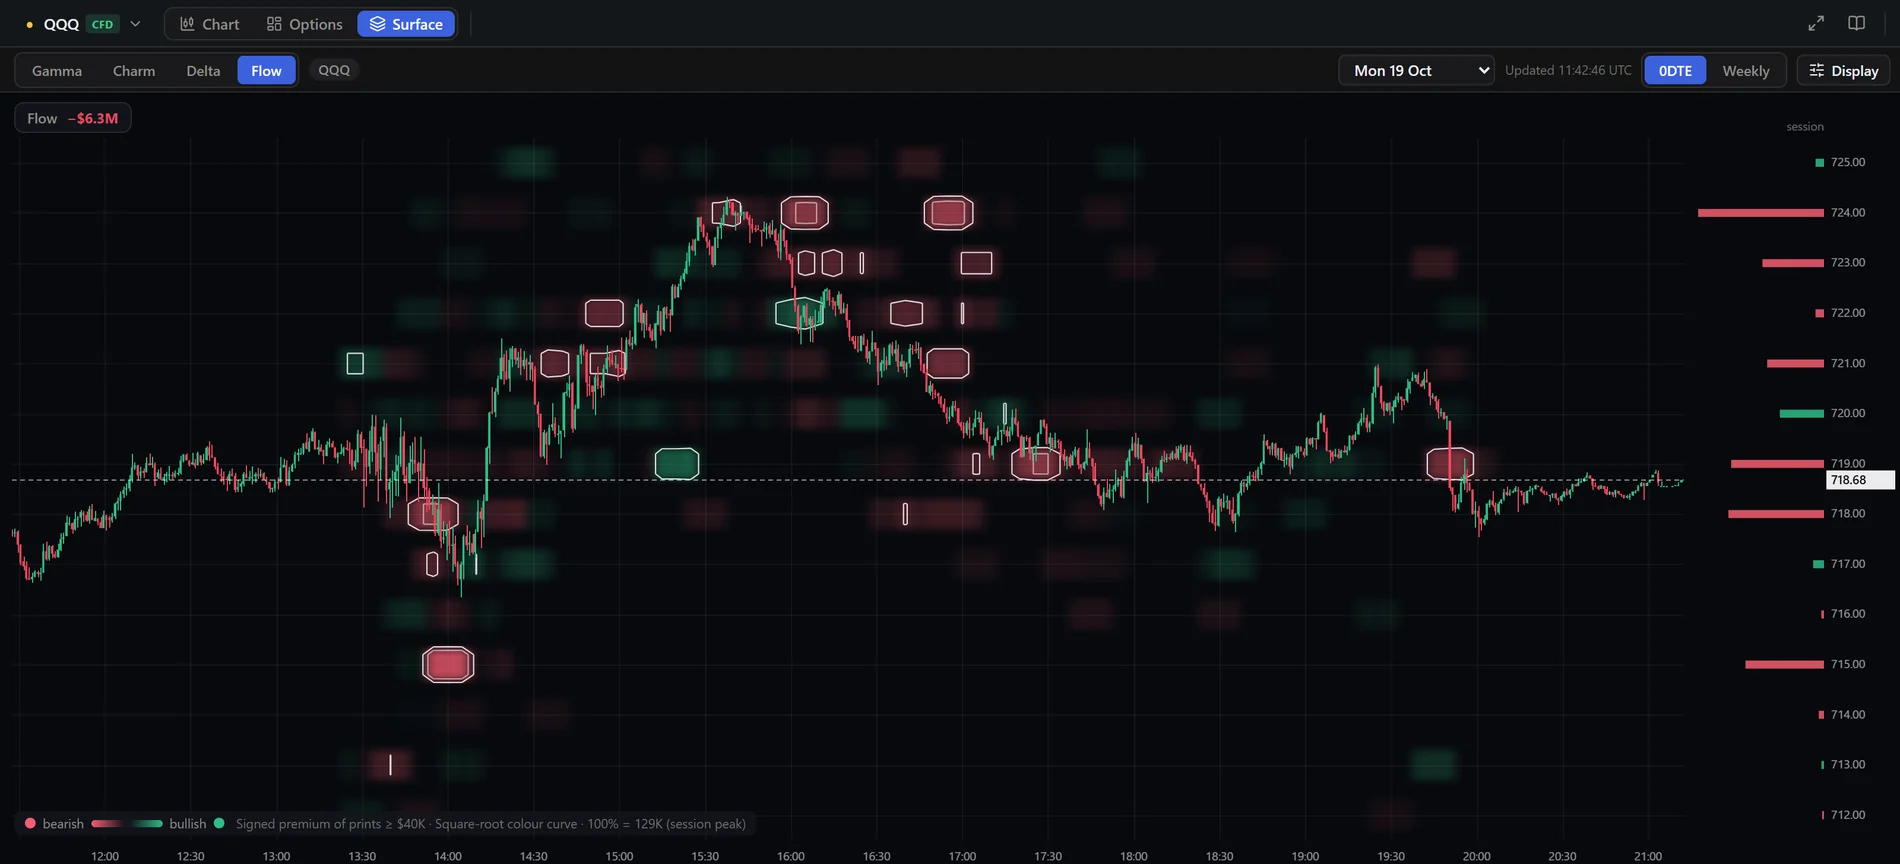
- Flow — not a model: real option trades from the tape, as signed premium per strike and time. Long calls and short puts count as bullish (green); long puts and short calls count as bearish (red). Legs of spreads and combos are left out because their direction is unreliable, and only prints above the minimum premium are drawn.
A worked example
On 19 October QQQ's two lows of the day — around 13:50 and 18:30 UTC — both reached the same lower gold gamma pocket near 717.5 and turned up from it. The afternoon high near 15:40 ran into the upper gold zone around 724. Into the close the charm layer showed purple above and gold below price. This is a reading of one session, not a signal: the same pocket can fail on another day, which is why you read it together with the flow layer and the other tools.
Replay a session
The Replay button next to Display works like the chart's replay: click a column to start there, and the map, the candles and the profile on the right show only what had happened by then. Each step is one snapshot; play, pause, step and speed are in the control bar at the bottom. Exit brings the whole session back. See Replay mode.
Display settings
- Colour — the scale is linear: the colour only changes how strong a value looks (brightness and contrast), the hover always shows the true number.
- Scale to — Session peak compares every moment of the day with the biggest value (default). Each snapshot compares strikes within one moment, which helps near expiry when everything brightens.
- Brightness and Contrast — tune the map so the candles stay readable.
- Walls ≥ % of peak — how strong a zone must be to get an outline (default 22%). Lower it to outline fainter pockets; raise it to keep only the strongest.
- Outline the walls, M1 candles, Smooth between strikes — switch each off for a plainer picture. With Smooth off you see only the strikes that really exist.
Moving around
- Scroll over the map to zoom the strikes; Ctrl or Shift + scroll (or scroll over the time axis) to zoom the time. Drag to pan; Reset brings the whole session back.
- Pick any day from the drop-down. A session for ETFs and indices is the New York calendar day up to the 16:00 ET close; for BTC and ETH it runs 08:00 UTC to 08:00 UTC.
- 0DTE | Weekly chooses the expiry scope for every layer.
- It is a model. Gamma, charm and delta assume dealers are long the calls and short the puts that customers trade; they are not observed positions. Treat the pockets as zones.
- Open interest is a daily number, so within a session the shape changes mainly because of price, time and implied volatility, not because new positions appear. The Flow layer is what shows new money.
- History is not recomputed. The calculation was refined on 20 October (dividend yield, better handling of missing volatility quotes, a 16:00 New York expiry time). Snapshots stored before that date keep the old values, so days before and after are not exactly comparable.
- Old days may have no candles. The map is built from stored snapshots, but candle history for older days is limited, so only the recent sessions show price over the map.