
- Pick a symbol (BTC, ETH, Gold, S&P 500 or Nasdaq) and a timeframe you actually trade (M5–M30 works well for intraday).
- Indicators → turn on GEX Heatmap and Options Bubbles. Add Net GEX if you want the regime in a pane.
- Widgets menu → Session Regime, then Block Trades and Liquidations (BTC / ETH). You can keep several widgets open at once: they stack in the panel on the right, and each one can be collapsed or closed.
- Set the noise filters: in the bubble settings raise Min premium until you see roughly 10–30 bubbles per screen; in the top bar's intensity bar raise the low end until only the stronger heat remains.
- Try it: hold Ctrl and click a big bubble with a white ring — its payoff appears on the chart.
- Click the book icon any time to return to this handbook.
Open several widgets side by side
Each widget opens as a panel next to the chart. Start with Session Regime, add Block Trades, then Liquidations — you read the regime, who is paying for it, and who was forced out, without leaving the chart.
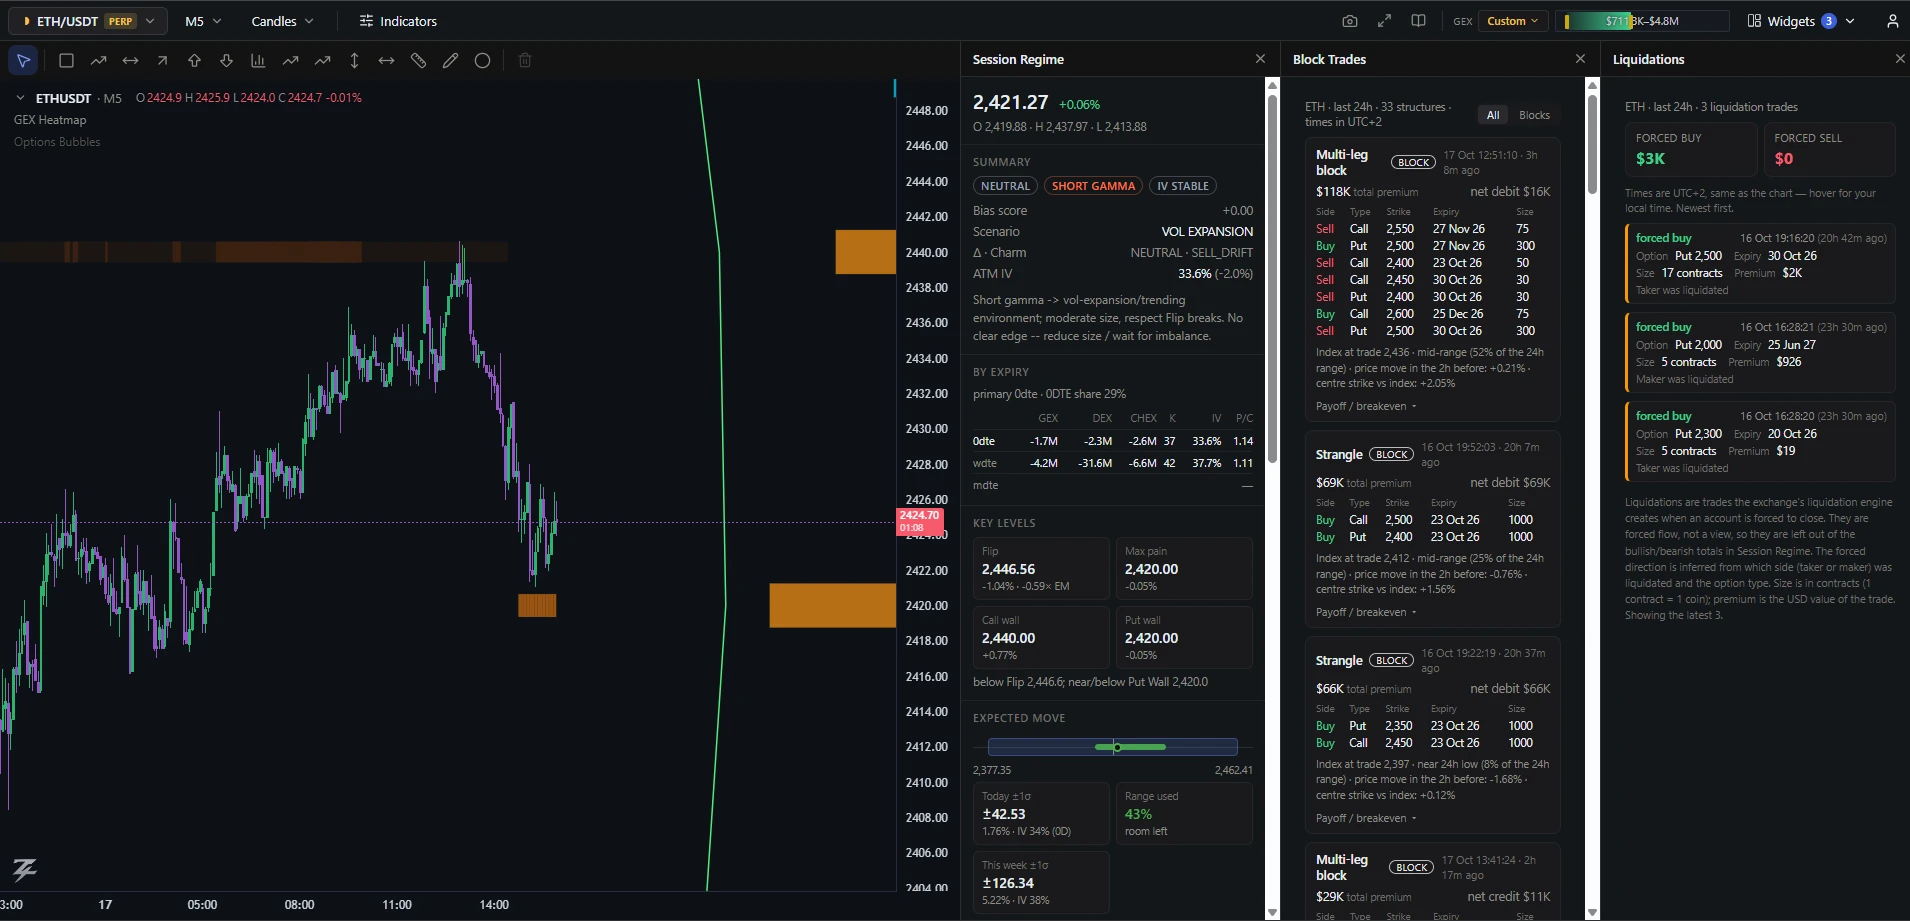
Chart or Options: two workspaces
The Chart | Options switch at the top left changes the whole screen. Chart is the candles with indicators and the widget drawer. Options drops the chart and gives you a desk of options panels — OI and volume by strike, the regime panels and the live tape. Both are remembered; the next chapters explain each.
Layouts: more than one chart
The Splits menu in the top bar shows two or three charts at once (side by side, stacked, or one large with two small). Click a chart to make it the active one — the symbol and timeframe pickers act on the active chart. The Sync switches decide what the charts share; all are off by default:
- Symbol and Interval — change one chart and the others follow.
- Crosshair — hover one chart and the same time lights up on the others.
- Time — scroll or zoom one chart and the others move with it.
- Drawings — a line drawn on a symbol is shown on every chart that displays that symbol.
Indicators and their settings are shared by all the charts.
On your phone
Open the same address on a phone and the terminal switches to a layout built for it: live price, layer chips, a bottom bar and tap-to-inspect for bubbles. See On your phone.