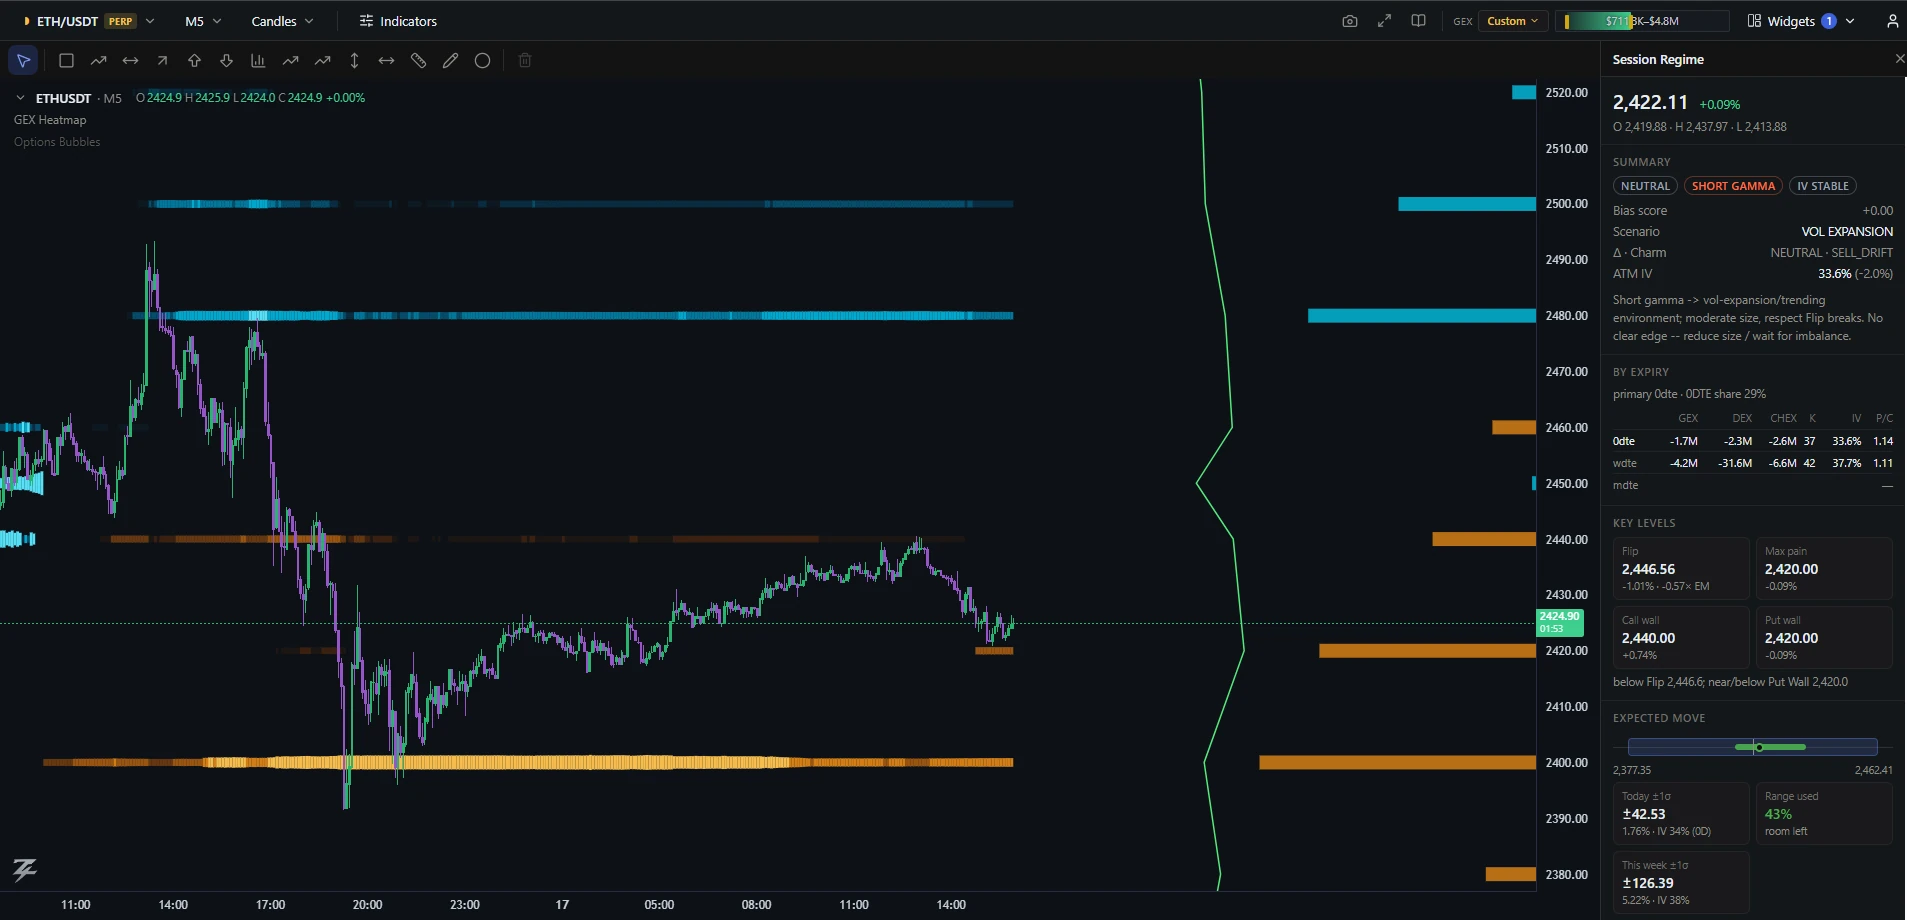
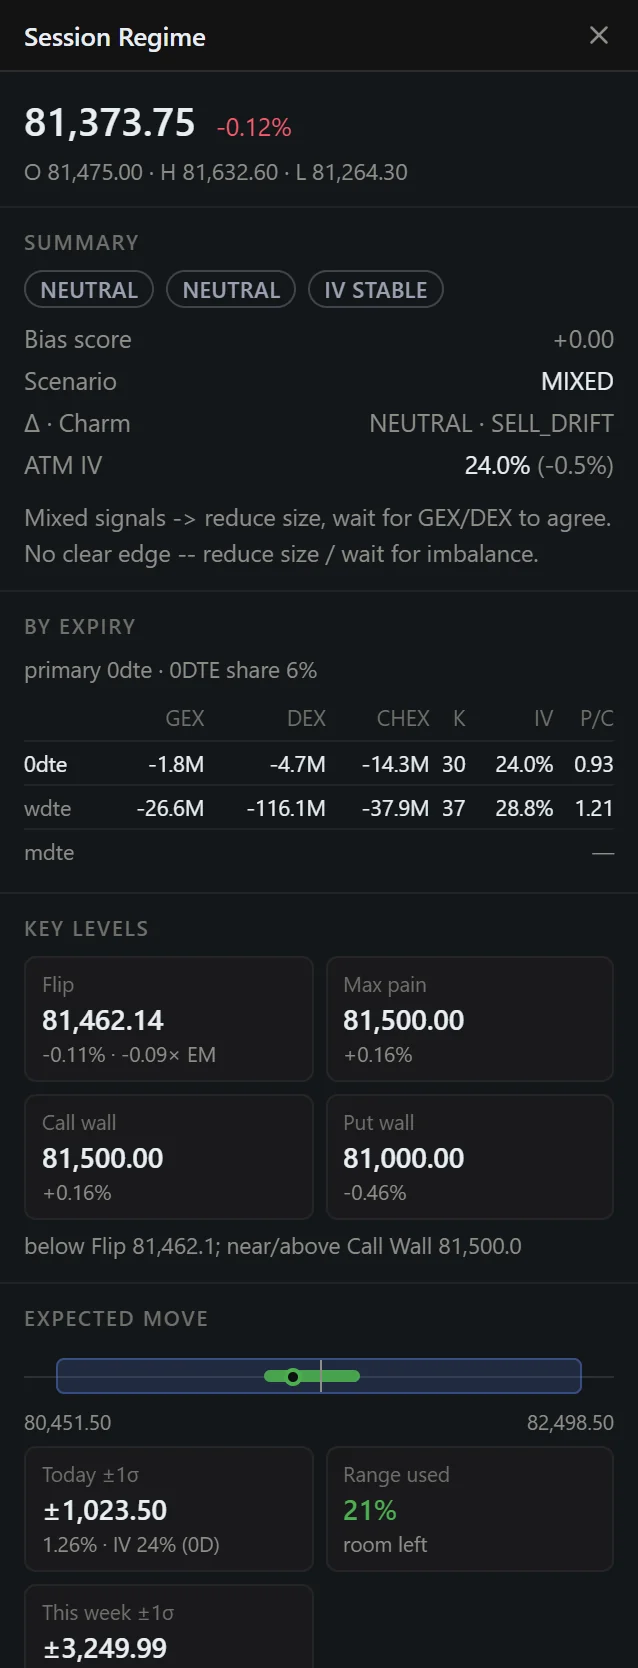
Open it from Widgets → Session Regime. It is your pre-session checklist in one panel; hover any tile for a tooltip. Work through it top to bottom.
Summary
One line each for the session bias, gamma regime and IV state, plus a scenario sentence. It is a quick read of the numbers below, not a forecast — use it to decide which regime playbook to start from, then verify with the sections that follow.
By expiry
GEX, DEX, CHEX, ATM IV and put/call for each expiry bucket (0DTE, week, month). If the 0DTE row and the weekly row agree, the picture is clean. If they disagree (for example 0DTE positive, weekly negative), short-term hedging pulls against the bigger structure: expect a pinned morning and a bigger move once 0DTE effects fade, or the reverse.
Key levels
Flip, Max pain, Call wall and Put wall with the distance from price, and the distance in EM units (multiples of the expected move). A level within about 0.5 EM is relevant today; beyond 1.5 EM is background.
Expected move
Today's ±1σ band, a bar showing the day's range and the last price, and Range used — how much of the priced move has been travelled.
| Range used | Reading |
|---|---|
| Under ~40% | The day still has most of its priced movement available. Breakouts have room. |
| ~40–80% | The day is maturing. Moves toward the band edges are normal; continuation needs fresh flow. |
| 80–100% | Getting full. Expect slowing, mean-reversion in positive gamma, or a catalyst-driven extension in negative gamma. |
| Over 100% | Options were wrong-footed. Expect higher IV next session; ranges often stay wide. |
The thresholds are rules of thumb, not statistics.
Volatility
| Tile | Low / negative | High / positive |
|---|---|---|
| IV rank | Options are cheap vs. recent history. Buyers have the edge in pricing; breakouts are less expensive to bet on. | Options are expensive. Premium sellers have the edge; structures that sell volatility tend to look better than ones that buy it. |
| IV vs RV | IV CHEAP — the market is pricing less movement than has been occurring. | IV RICH — the market is pricing more movement than has been occurring. |
| Term structure | Inverted (short IV above long) — near-term fear or event. Faster moves are more likely soon. | Contango — calm; no near-term event priced. |
| Skew | Negative: calls richer than puts — upside chasing. | Positive: puts richer than calls — demand for downside protection. |
Positioning
- Put/Call OI — above 1 means more put contracts outstanding. A high ratio is not bearish by itself (puts are often hedges); watch it for changes.
- GEX focus — how much of total gamma sits in the top three strikes. High = levels are sharp and few; low = pressure is diffuse and levels are softer.
- Call / Put OI wall — where contracts are stacked. Often become targets as expiry approaches.
- ITM share of OI — how much open interest is already in the money. A large share means positions are deep in profit or loss; read it as "stretched", not as a signal.
- OI change (24h) — rising OI at a strike means positions were added there; falling means closed or expired. A wall that is growing is more trustworthy than one that is fading.
- Max volume strike — the most-traded strike today, i.e. the day's focus.
Confluence zones
Zones where several independent levels (Flip, walls, OI walls, Max pain, Max volume, expected-move edges) land within a fraction of a percent of each other. Each zone gets a score from how many different kinds of level it contains. Use the top two or three as your map: reactions are more likely there than at single levels. The score is a ranking aid, not a probability.
Options tape · today
- Net bull − bear — bullish money (long calls + short puts) minus bearish money (long puts + short calls) since the open. The split bar shows the share.
- Windows (5 m, 15 m, 30 m, 1 h, 4 h) — the same net over shorter periods. Same sign across all windows = persistent flow. Short windows flipping against the long window = a possible turn; wait for confirmation in price.
- P/C premium — put money relative to call money. Spikes show where hedging demand arrived.
- Biggest single-leg print — the largest individual trade today.
- Spread legs and liquidations are excluded from the net so the number is closer to real directional intent.