
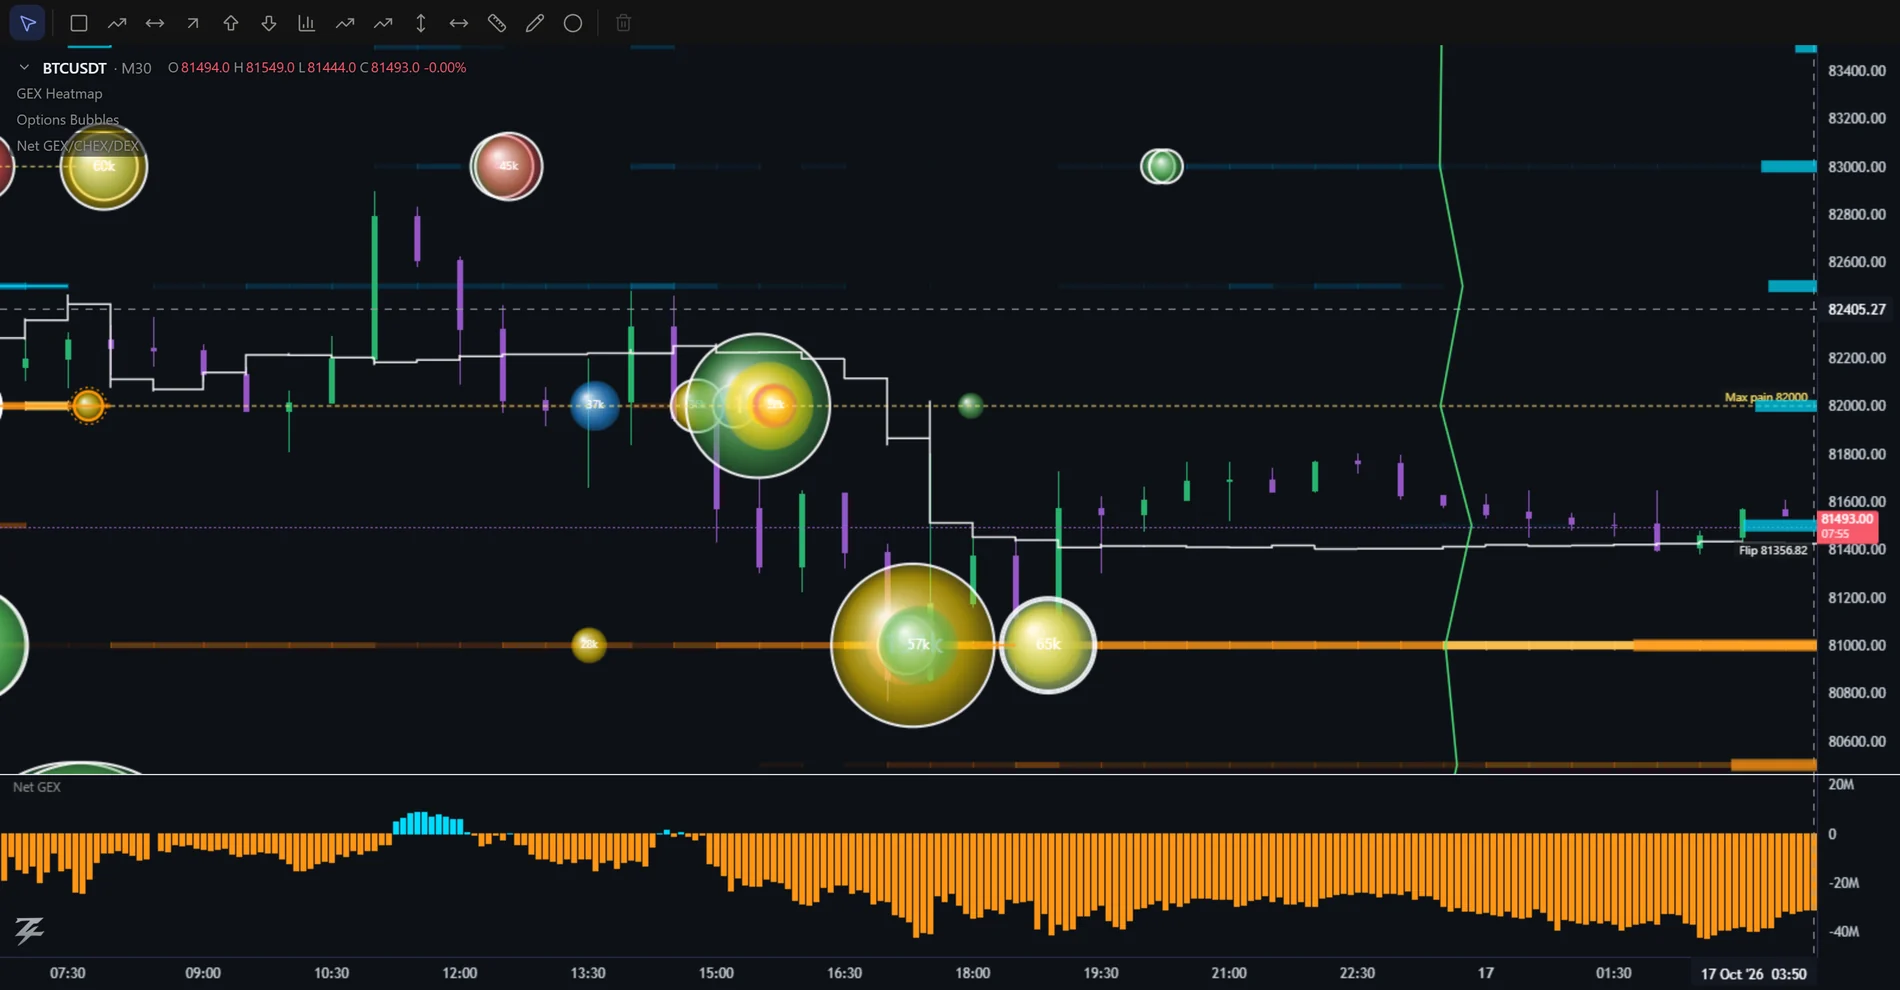
Shows where options money is trading right now. Each bubble sits at the trade's strike (vertical) and time (horizontal); bigger = more premium (or volume).
Rings (BTC / ETH)
- Solid white — a block trade: a large trade negotiated off the order book. Usually institutional; usually deliberate.
- Dashed — one leg of a spread / combo. Not a directional bet on its own — read it as part of the structure (see Block Trades and the payoff chapter).
- Orange double — a liquidation: a forced trade, not a view.
Rings on GLD / SPY / QQQ (inferred)
US ETF options data carries no block or combo flags, so the terminal infers them from the tape and labels them "inferred": a dashed ring marks the legs of a multi-leg structure (spreads, straddles, strangles, butterflies, condors — found where legs trade at the same moment, in the same size, on the same exchange) and a solid white ring marks an unusually large single print. Ctrl+click a ringed bubble to see the structure's payoff; the Block Trades widget lists the biggest ones. Buy / sell sides of the legs are estimates. There are no liquidations on ETF options.
A violet ring marks a sweep: one order split across three or more exchanges within 5 milliseconds, on the same contract and side, with a total premium of at least $100K (SPY, QQQ) or $25K (GLD). The whole cluster is drawn as one bubble. The clustering itself is real, but it cannot prove that a single trader sent it, so it is labelled inferred. Switch sweeps on or off in the Structure ticks of the bubble settings.
Choose the exchange (BTC / ETH / XAU)
Quickest way: the Options box in the top bar (next to the chart type) switches the whole options data at once: bubbles, flow, profiles, GEX and Greek Ladder. On BTC and ETH pick Deribit, OKX or Binance; on gold (XAUUSDT) pick GLD (ETF), Binance or OKX. Silver (XAGUSDT) only has Binance, so it shows no box. Gold and silver strikes are shown at the exchange's real strike (no price correction), so they can sit a few points away from the perpetual's price.
On BTC and ETH charts the bubble settings have an Exchange box: Deribit (default), OKX, and for BTC also Binance. On the gold chart (XAUUSDT) the choice is Binance or OKX. The same indicators then read that exchange's trades: Options Bubbles, Options Flow, Daily Options Profile and the Options profile tool. Each exchange is collected on its own, with its own contract sizes, so premiums are comparable, but the exchanges differ: OKX and Binance have no block, combo or liquidation flags (so those ticks show nothing), OKX trades carry the implied volatility at the fill, and OKX / Binance have far smaller volume than Deribit, so lower the minimum premium if the chart looks empty.
Blocks, spreads and sweeps on OKX / Binance
Deribit marks block trades and combos itself; OKX and Binance do not mark them on the normal tape, so the terminal builds the same rings in three layers, from certain to inferred. 1) Official blocks: OKX publishes its block trades with the strategy name (Call spread, Strangle, Iron condor, ...) and Binance publishes the legs of its block trades; both are added as extra trades with the block ring and, for several legs, the structure name (Binance legs that fall in the same millisecond are one block and are named from their shape). 2) Sweeps: a market order that walks the book prints many fills in the same millisecond on one contract; they are merged into one bubble, and from three fills and $20K a violet sweep ring is added (the tooltip shows the number of fills). 3) Inferred structures: different contracts of the same coin printed in the same millisecond with matching sizes (equal legs for a spread, straddle or strangle; 1:2:1 for a butterfly; four equal legs for a condor) get a dashed combo ring marked "inferred". Unequal sizes are never labelled, because two unrelated trades landing in the same millisecond are common. Checked against OKX's own named blocks, the shape recogniser agreed on all 151 multi-leg blocks.
Gold and silver options only have weekly expiries, so the Expiry filter set to 0DTE hides every bubble on XAUUSDT and XAGUSDT: pick All or up to 7 days. Silver (XAGUSDT) has options bubbles, a thin GEX (a handful of strikes) and footprint on Binance data.
Filters
- Structure (tick boxes) — tick what you want to see: single trades, spread / combo legs, block trades (large prints on ETFs), liquidations (BTC / ETH). Each trade belongs to one type, matching its ring.
- Min premium / volume — the main noise control. Raise it until you see only the trades that matter for your symbol.
- Category — show one or two colours at a time to separate buyers from sellers.
- Moneyness — ITM / ATM / OTM only. OTM flow is more speculative; ATM / ITM flow is more about hedging and real exposure.
- Expiry (DTE) — 0DTE, ≤ 7 days, 7–30 days, > 30 days.
- Structure — all, single legs only, spread legs only, blocks only, liquidations only.
- Bubble style — Flat (default: one opacity, no shading) or 3D (glossy balls with a highlight). It only changes how the bubbles look, never their size or position.
Payoff on the chart: Ctrl+click a bubble
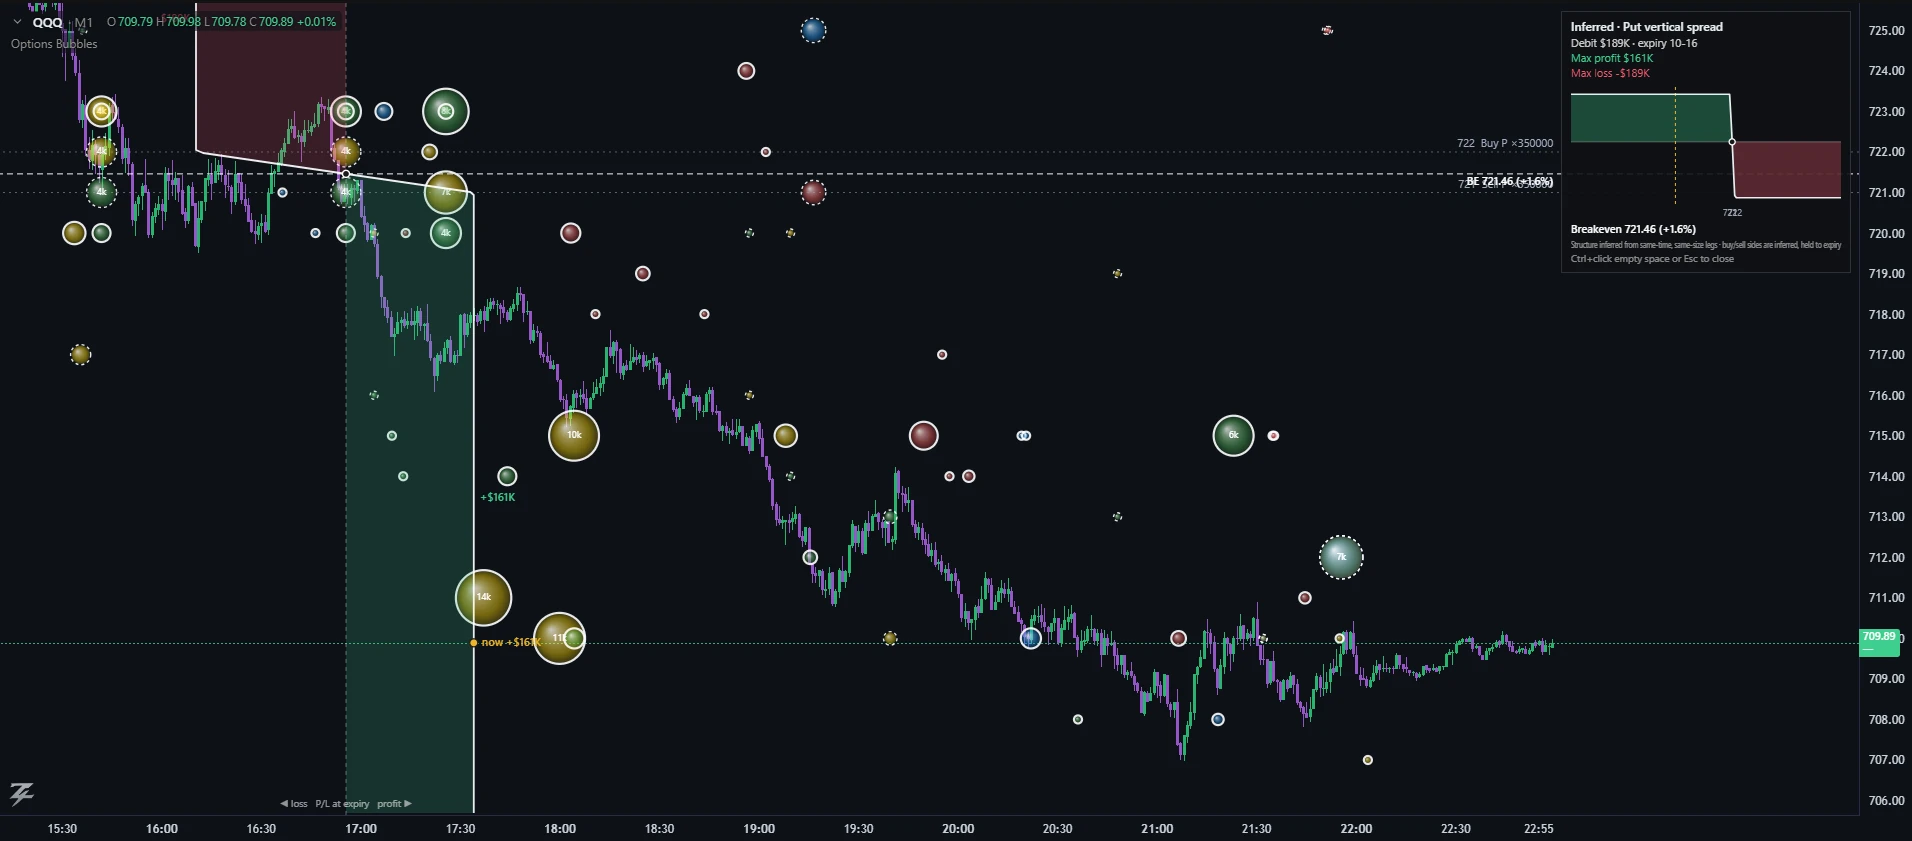
Big bubbles let you see the trades of the larger players. The payoff shows what they are actually betting on — which price they need, and where they lose — so you can judge the direction the bigger money is leaning rather than guessing from the size alone.
On BTC and ETH, hold Ctrl (⌘ on Mac) and click a bubble to see the profit-and-loss shape of the structure it belongs to, drawn straight on the chart:
- White dashed lines across the chart mark the structure's breakeven prices (with % from the current price). Grey dotted lines mark its strikes, labelled Buy / Sell and size. They sit on the same price scale as the candles, so you can see exactly which candles and levels they touch.
- The profit/loss line itself is drawn over the candles. A vertical dashed line in the middle of the chart is "P/L = 0". The white curve bends to the right (green) where the structure makes money and to the left (red) where it loses, at every price on the chart's own price scale. A yellow dot shows where you are now and what the structure would make or lose if it expired at today's price; the biggest profit and loss in view are labelled. The width rescales to what is visible, so the shape is always right even when you zoom.
- The panel at the top right shows the structure name, debit or credit, max profit, max loss, and a mini payoff curve (green = profit, red = loss, yellow dashed = current price, dots = breakevens). The mini chart always covers all strikes and breakevens, even when your chart is zoomed in.
- A bubble that belongs to a block or combo shows the whole structure (all legs), not just the one bubble you clicked. A single-leg bubble shows that option on its own.
- Close it with Esc, by Ctrl+clicking empty chart space, or by Ctrl+clicking the same bubble again. Ctrl+clicking another bubble switches to that one.
Use it as a fast filter: click the biggest bubbles near a GEX band and ask whether their breakevens and profit peaks line up with the levels you are watching. Chapter 12 explains how to read the shapes.
On a phone: tap a bubble
There is no Ctrl+click or hover on a phone, so a tap opens a card for the trade: type and strike, expiry, how long ago it printed, premium, size, price, IV and the Block / Combo / Sweep / Liquidation tags. Show payoff at expiry on the card draws the same payoff as Ctrl+click; tap empty space or ✕ to close. See On your phone.
Worked example: follow the size, then open the bet
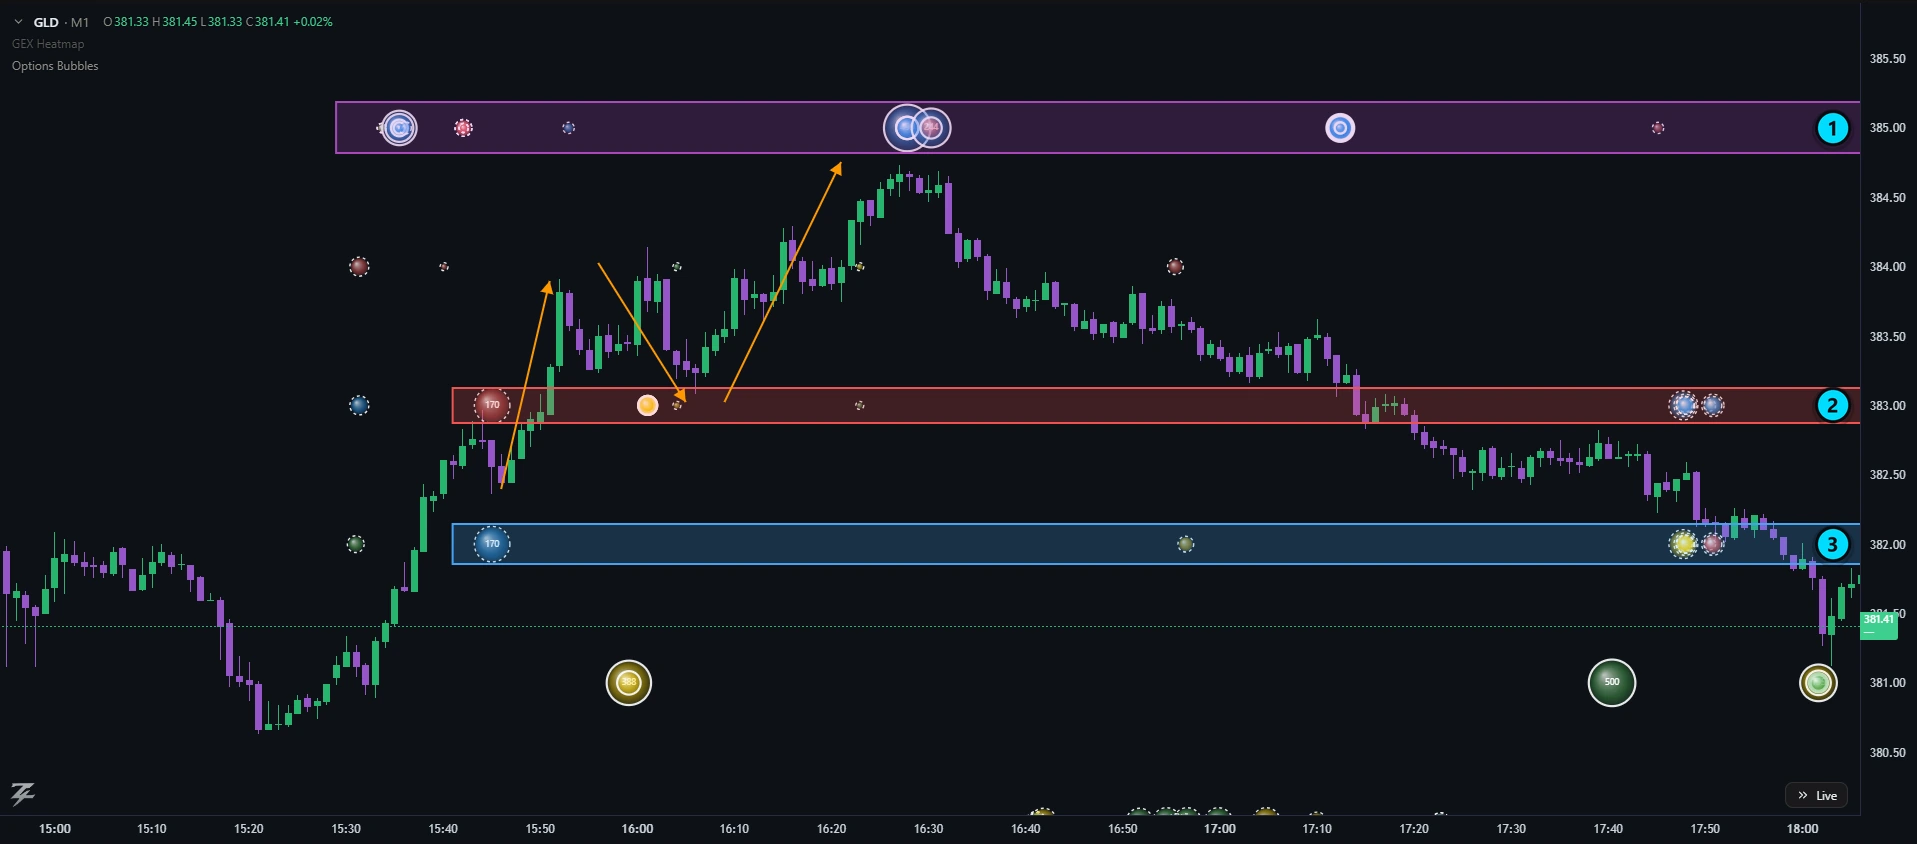
- 385 — large bubbles with white block rings stack here. Price runs into the zone around 16:30 and turns back.
- 383 — a 170-contract red bubble (a sold call) marks the band. Price pulls back into it (orange arrow) and holds before the next leg up.
- 382 — its partner: a 170-contract blue bubble (a bought call) one strike lower. Together they form one call spread.
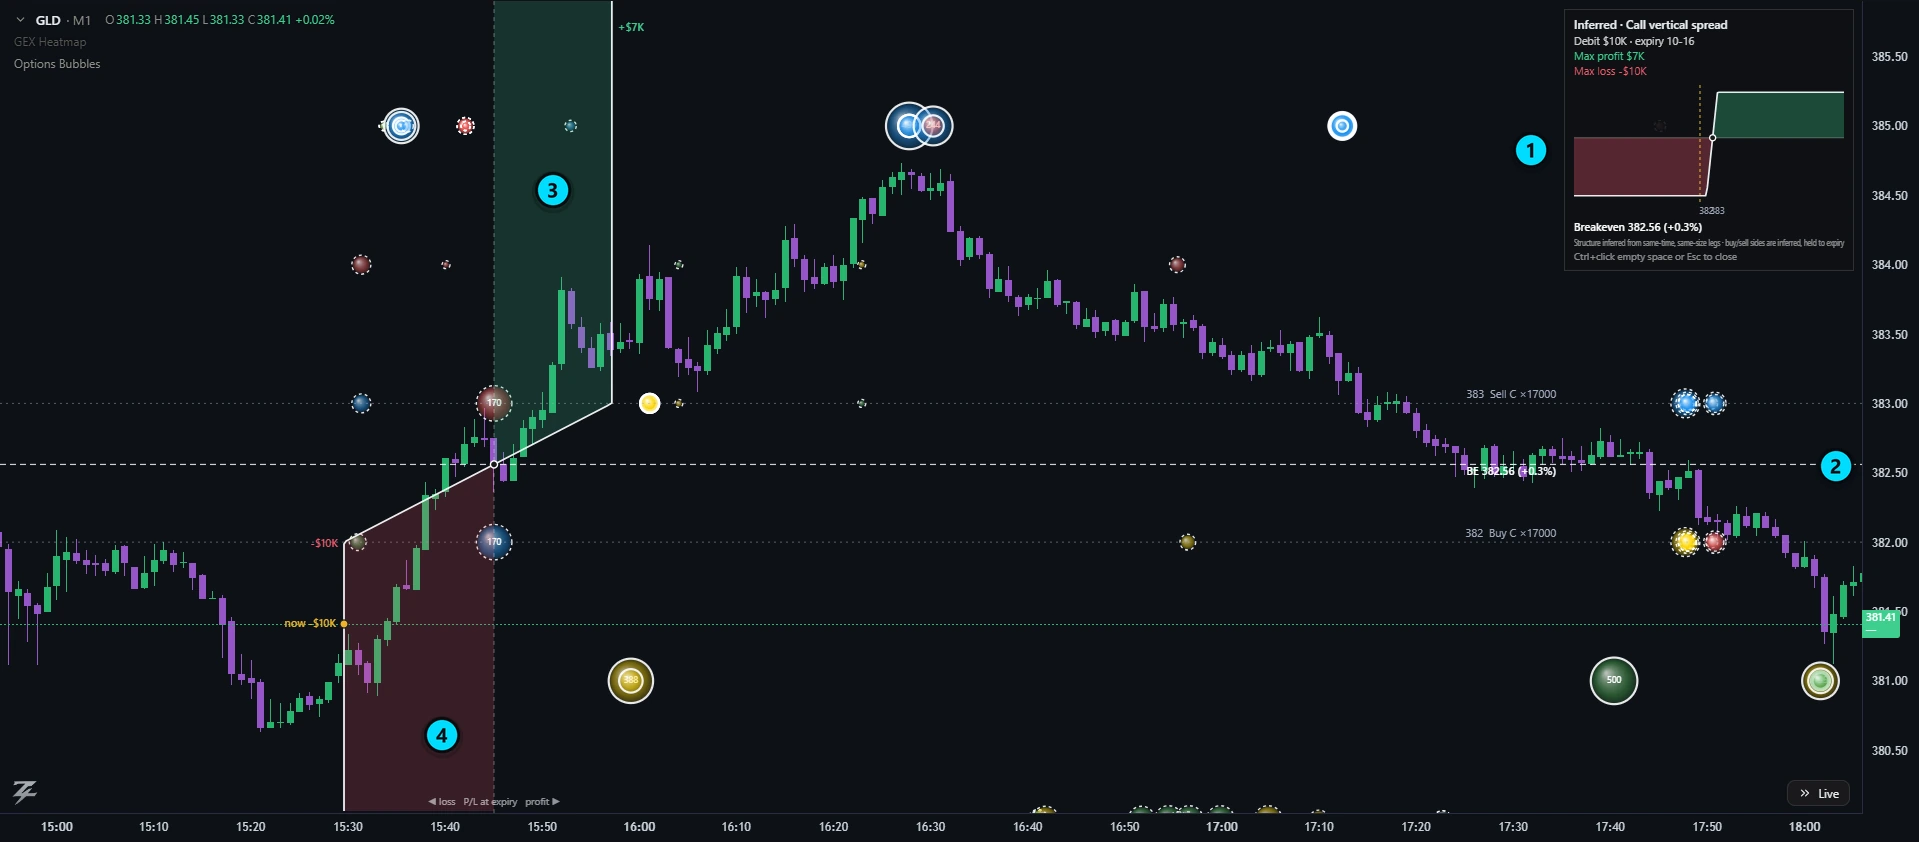
- Structure panel — an inferred call vertical spread: buy 382 / sell 383, 170 contracts each, $10K debit, max profit $7K, max loss $10K.
- Breakeven 382.56 (+0.3%) — the dashed line. The buyer profits only if price finishes above it.
- Profit side (green) — above 383 the gain is capped at +$7K.
- Loss side (red) — below 382 the loss is capped at the $10K paid.
This is an illustration of how to read the tools on one session, not a signal: the buy/sell sides of ETF options are inferred from the tape, and a level that held once can fail next time.
Reading patterns
| Pattern | Reading |
|---|---|
| Cluster of blue (long calls) above price, near expiry, OTM | Speculative upside bets or a "squeeze" attempt. Their effect on price is strongest if they sit near a call wall. |
| Cluster of green (short puts) below price | Sellers are comfortable owning the underlying at those strikes — a premium-selling "floor". If price falls through them, they become losers and may be closed, adding to the move. |
| Cluster of yellow (long puts) at or just under price | Insurance or downside speculation. Look at the size and DTE: large, short-dated, near price = urgency. |
| Cluster of red (short calls) above price | Sellers capping upside. Strong overhead supply near a call wall reinforces resistance. |
| Blue + green together (long calls and short puts) | Both legs of a bullish view. Often one risk-reversal or a trader adding bullish exposure two ways. |
| Many big bubbles at one strike across hours | That strike is a focus. If it also sits on a GEX band or wall, it is a priority level. |
| A giant bubble with a solid ring | A block. Check Block Trades to see whether it was a single leg or part of a structure. |
- Combine with GEX. Bubble clusters on a GEX band or wall add conviction to that level; bubbles in empty space are just noise.
- Use "single legs only" to remove spread legs, then look at blocks and combos separately.
- Check the DTE. A 0DTE cluster matters for today; a 30+ day cluster is longer-term positioning.
- Look for sequences. Repeated trades at the same strike over minutes usually mean one large order being worked.
A bubble shows what traded, not why. On Gold, S&P 500 and Nasdaq the buy/sell side is estimated, so treat single bubbles there as less certain than clusters.
Options profile: bubbles added up by strike
Bubbles show single trades. A profile adds them up: one bar per strike, so you see which strikes carried the most options activity over a period. Two tools do this, both on BTC, ETH and XAU (and the other symbols that have Options Bubbles).
- Turn it on from Indicators → Profile. It draws one profile per day, automatically, for the last 3 days that have data (change the number in its settings).
- A day runs from the new day after expiry to the next expiry: BTC and ETH 08:00 UTC to 08:00 UTC; XAU and ETFs the New York session (04:00 to the 16:00 expiry). On XAU and ETFs each day is split into three profiles: Early (before 09:30 New York), US (09:30 to 16:00) and Late (after the close), each scaled on its own; Early and Late are thin because most trades happen in the US session (switch the split off in the settings). Each profile stays inside its own day frame, so you can compare days side by side. Today's profile grows as trades arrive.
- Style: Total with a 70% value area (POC, VAH, VAL, like a volume profile), 4 types stacked, Bullish | Bearish, Net (bullish − bearish), Call | Put, or Net (call − put). Measure in contracts or premium. The Expiry (DTE) filter works like the one in Options Bubbles (for example 0DTE only). In Replay the profiles only count trades up to the replay clock and grow as it plays. Bullish = long calls + short puts; bearish = long puts + short calls.
- Find it in the left toolbar under Projection and measure → Options profile (by strike). Click the start, move the mouse (the profile updates live), click the end.
- Drag either edge to change the range; drag the box to move it. The numbers are recomputed instantly. Several can sit on the same chart.
- Select it and click the gear on its little toolbar (next to Clone and Delete) for the style, measure, minimum print size, strike grouping and bar width. Changes apply instantly, and every new profile (and every new drawing) automatically reuses the settings of the last one you adjusted.
A profile uses the same options tape as the bubbles, so it shows what traded, not why. On Gold and ETF-based symbols the buy/sell side is inferred from the quote, and the tape only counts prints above the minimum size set for Options Bubbles. Hover a bar in the viewer-style tools for the long/short call/put split.