
What it's for
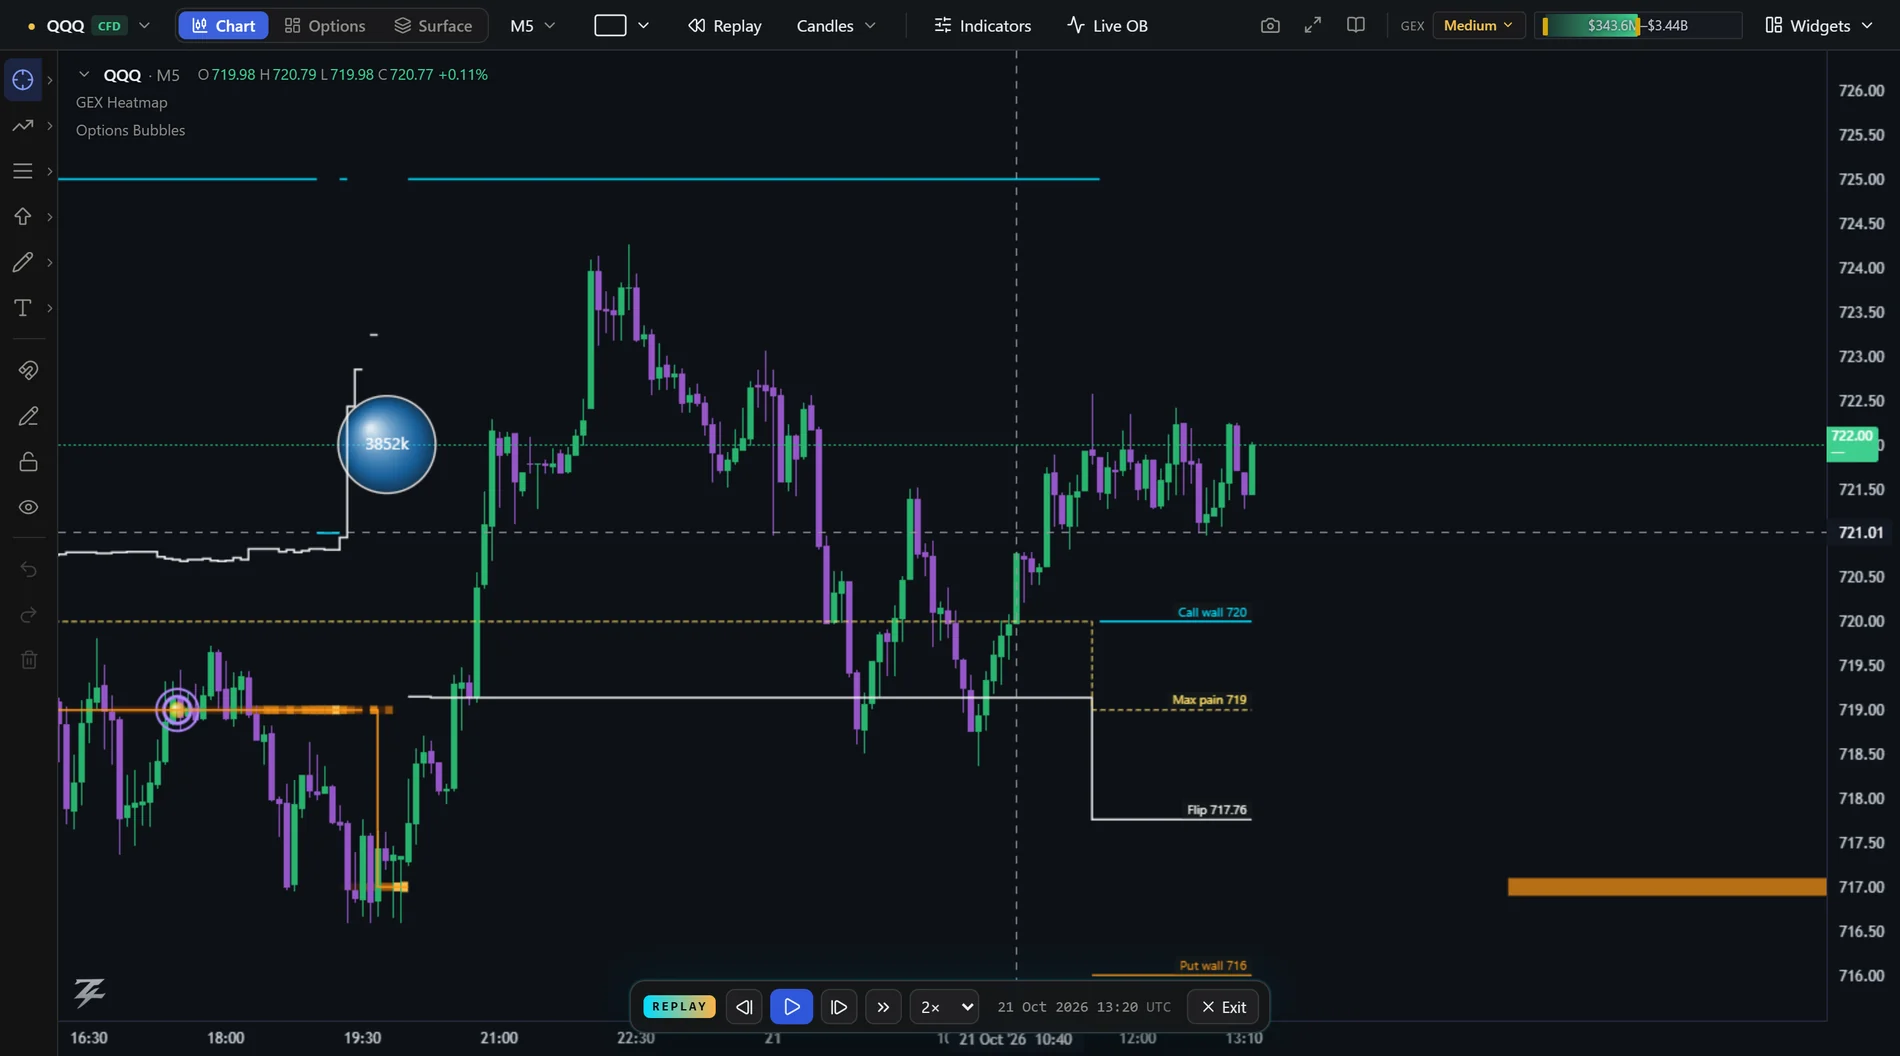
Replay turns the last few days of data into a practice tape. Pick a bar, and everything after it disappears — the candles, the GEX heatmap, the walls and the options bubbles. Press play and they come back one bar at a time, in the order they happened. Use it to ask: what did I see at that moment, and what did I do with it?
Start a replay
- Click Replay in the top bar (next to the Splits menu). A banner asks you to click a bar.
- Click the candle where you want to start. Everything to its right is hidden.
- Use the control bar at the bottom of the screen.
The control bar
- ◀| and |▶ — one bar back or forward (the arrow keys do the same).
- Play / Pause — runs one bar per tick (Space does the same). It stops by itself at the newest data.
- » — jump to the newest data.
- Speed — from 0.5 to 30 bars per second.
- Clock — the replay time in your selected time zone.
- Exit (or Esc) — back to live; nothing is lost.
What replays, and what does not
- Replays: candles, the GEX Heatmap with its Flip, walls and Max pain, the profile on the right, Expected Move, the Net GEX pane, Options Bubbles and the Options Flow pane.
- Paused during replay: tools that have their own live feed — BigTrade, Footprint, Volume Profile, FVG, Absorption and the other order-flow layers. They are switched off while you replay so that they cannot show you the future, and come back when you exit.
- IV skew is hidden in replay because it is only available for "now".
- The GEX Profile widget follows the replay time. Panels that come from their own live data — Session Regime, the options tape, Block Trades — keep showing the present.
How to use
- Practice the routine. Pick the open, write down the Flip and the walls, then step forward and see which level was tested.
- Replay a level that worked — and one that did not. A wall that held and one that failed look alike until price gets there.
- Slow down at the walls. Use 0.5× or single steps when price is near a wall and watch the bubbles that print around it.
Replay on Surface
The Surface map has the same control: a Replay button next to Display. Click a column and the map shows only the snapshots up to that time, together with the candles; each step is one snapshot. See Surface for what the map shows. Surface is coming soon to the web.
Good to know
- How far back it goes. Replay works on the data already loaded in your browser — about the last three to four days of candles, GEX snapshots and options trades. It does not fetch older days.
- It is not a backtest. The prints are real, but the GEX levels are a model and fills are not simulated. Treat it as a way to learn to read the tools, not as proof that a setup works.
- Plans. Replay is included with the trial and Live plans; the Free plan shows a lock.
- Phones. The Replay button is on the computer layout; the phone layout does not have it yet.