
Where it is available
Footprint and BigTrade work on BTC, ETH and the Hyperliquid perps in the symbol list (Gold, S&P 500, Nasdaq), on Live plans. Free accounts see the GEX Heatmap and Options Bubbles only.
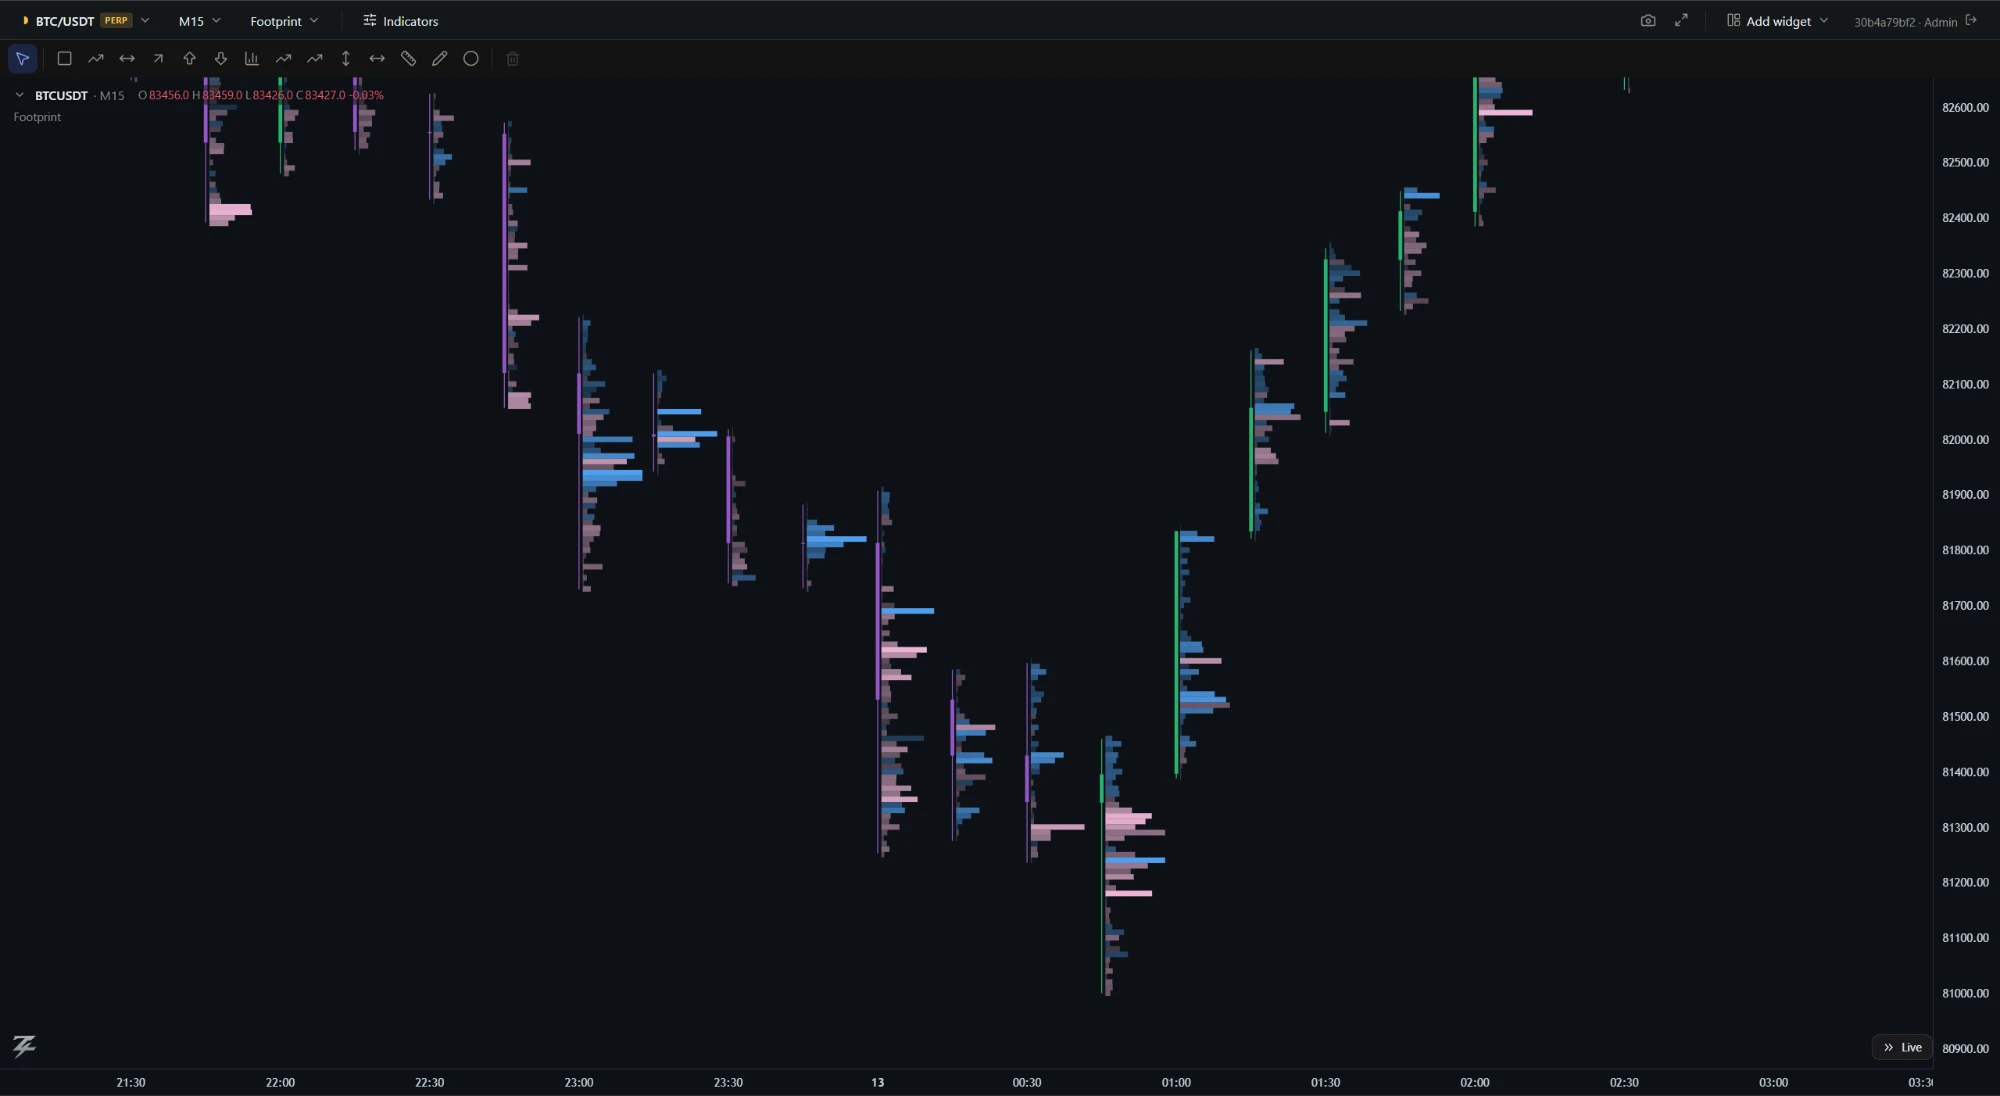
Footprint shows buy vs. sell volume at every price inside each candle and highlights imbalances. BigTrade Bubbles mark large futures orders — blue buy, pink sell. Use them as the confirmation layer: the options map tells you where to look, and these tell you whether real buying or selling is happening at those levels.
Three display styles
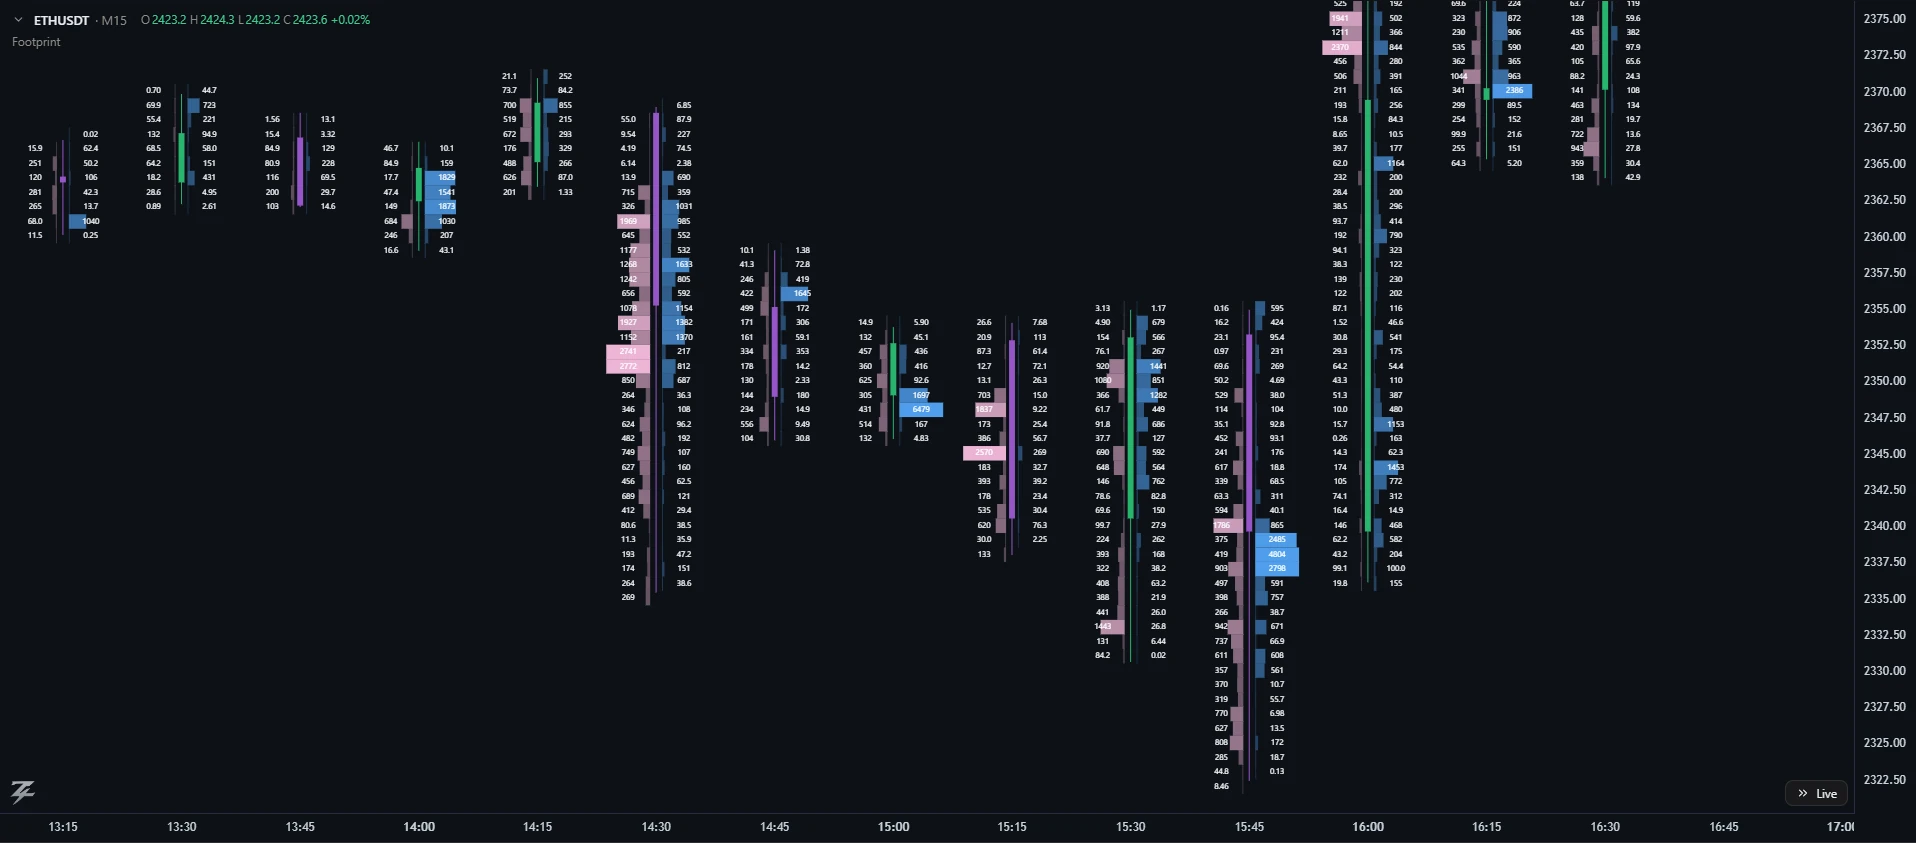
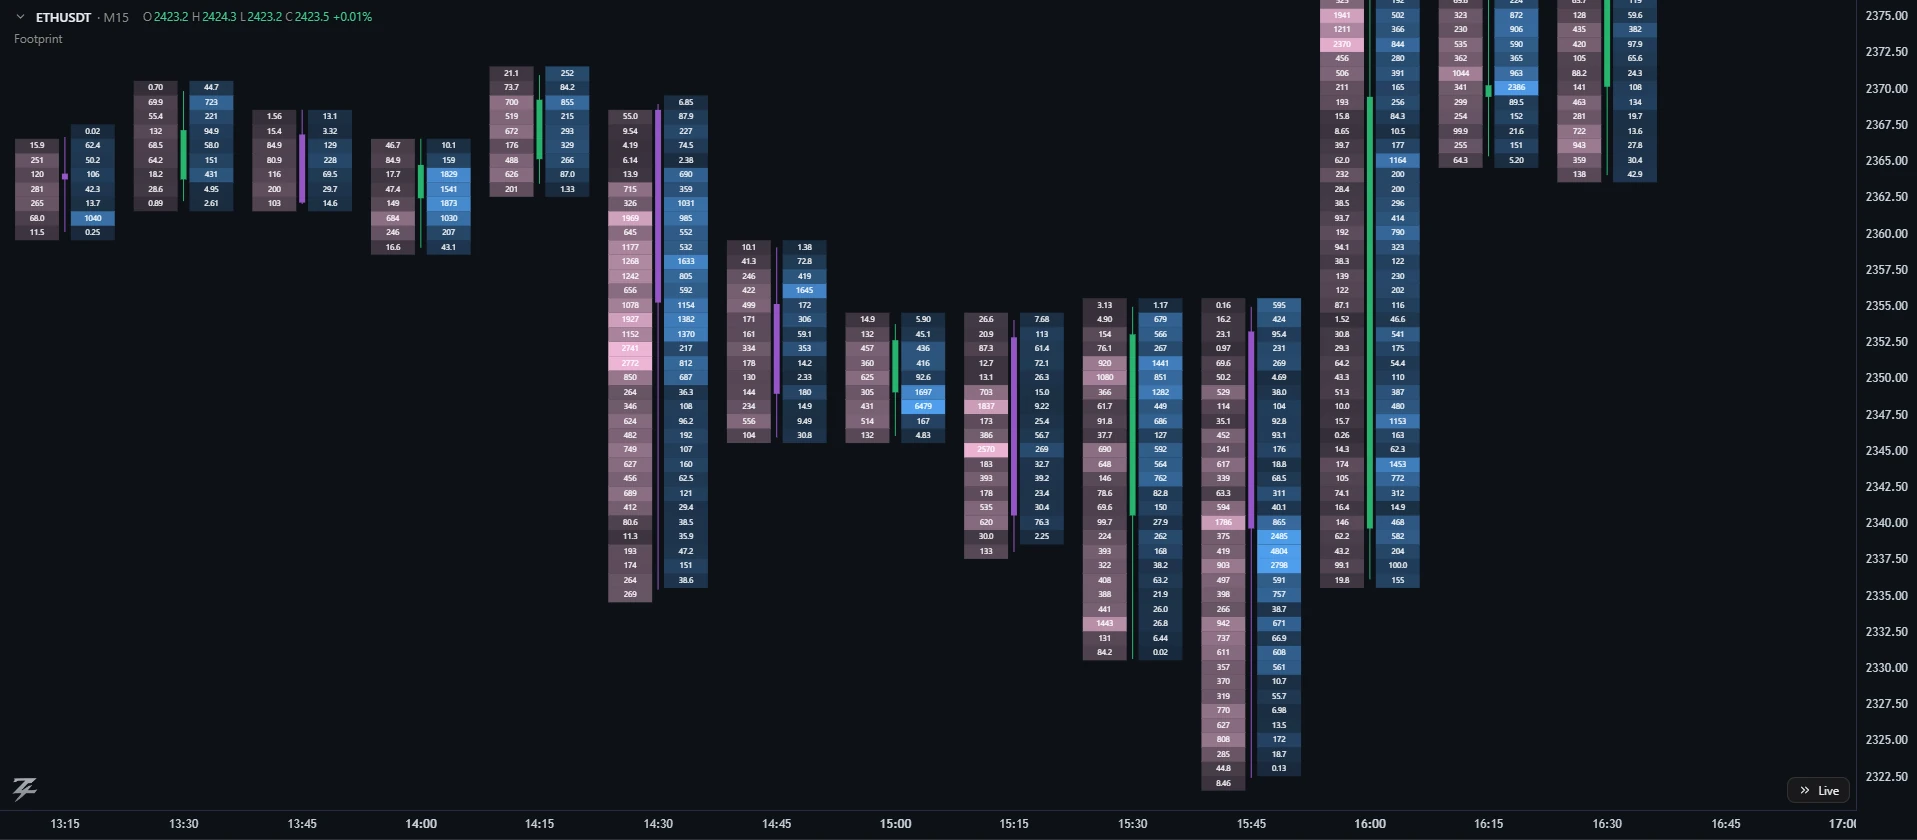
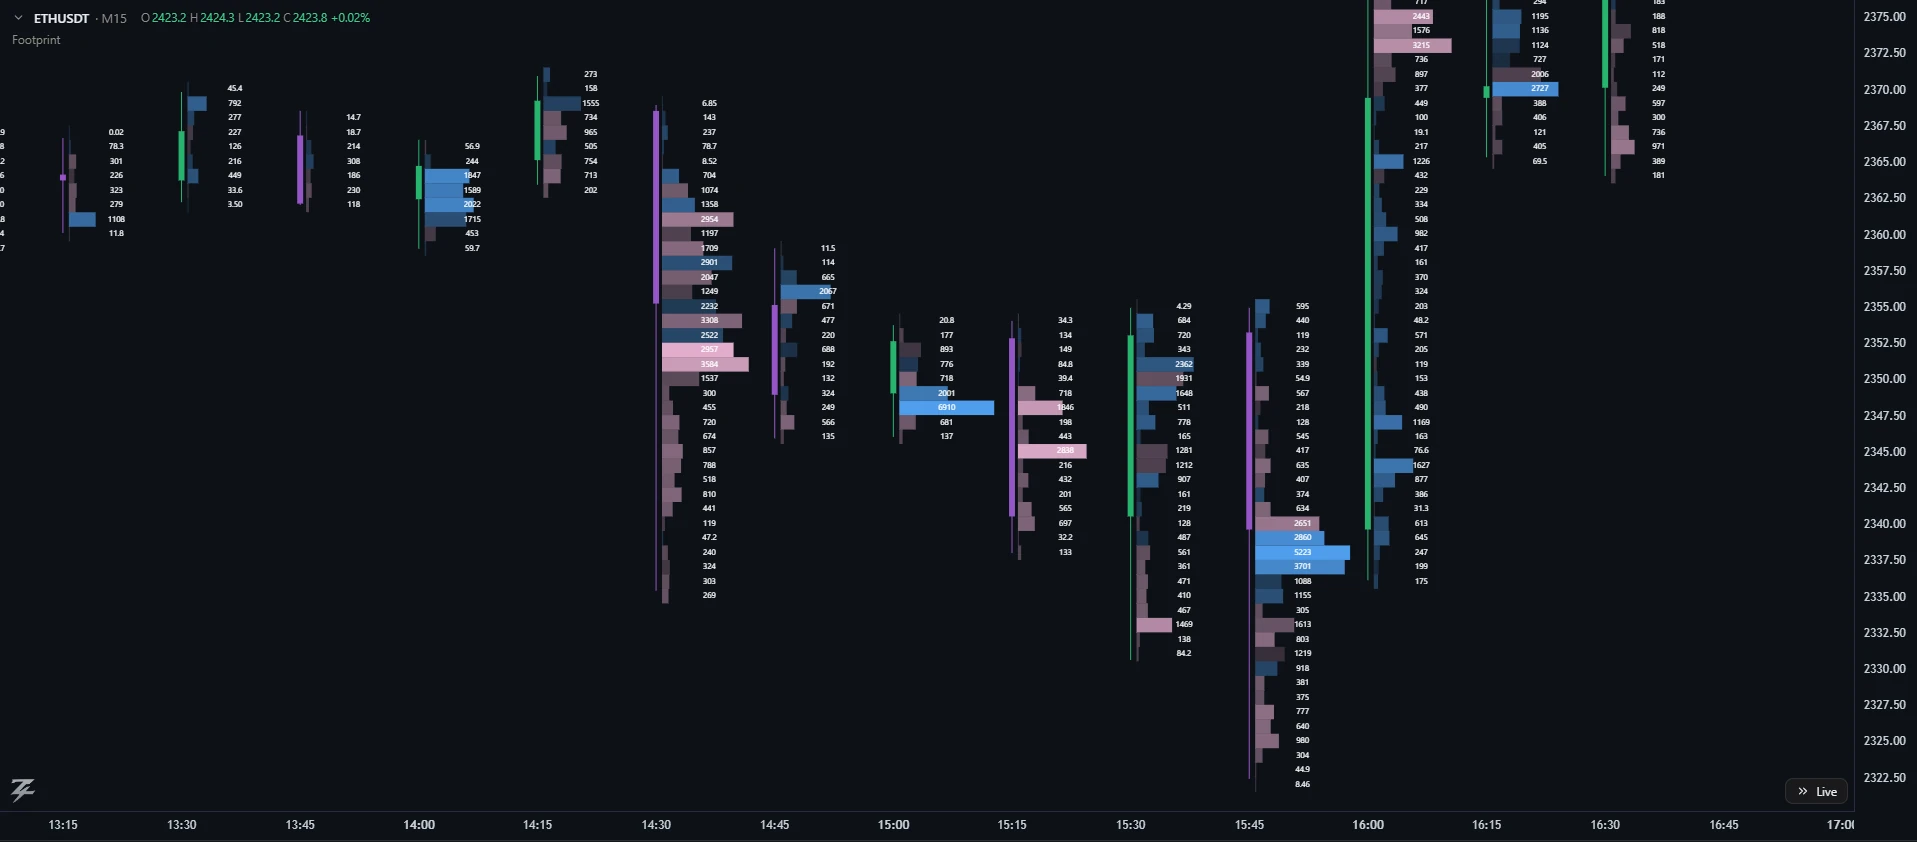
- At a wall or band: heavy one-sided volume that fails to move price = absorption (the wall is holding). Heavy volume that pushes through = the level is breaking.
- Imbalances stacked on one side across consecutive prices show aggressive participation.