
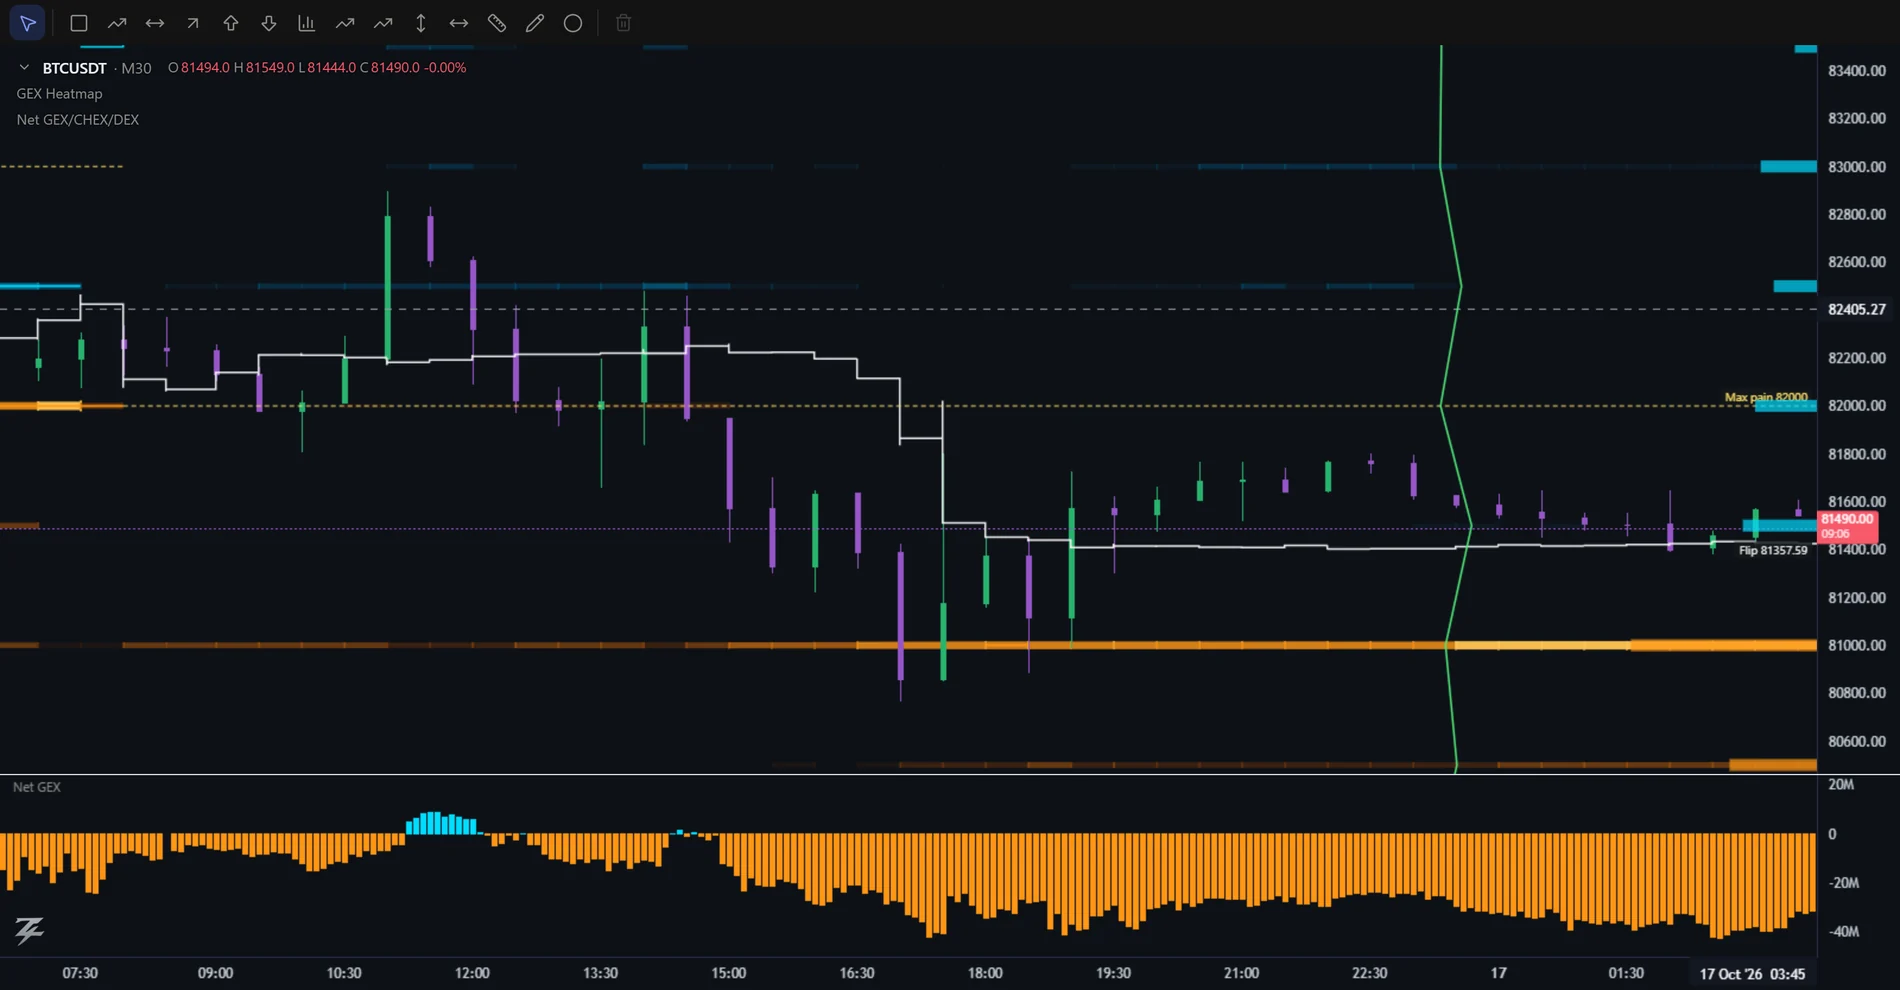
Shows which price levels carry the most dealer hedging pressure, and how that changed over the last few days. Brightness is strength; cyan is positive gamma, orange is negative. Lines mark the Flip, Call wall, Put wall and Max pain, and the profile at the right edge shows the latest snapshot by strike.
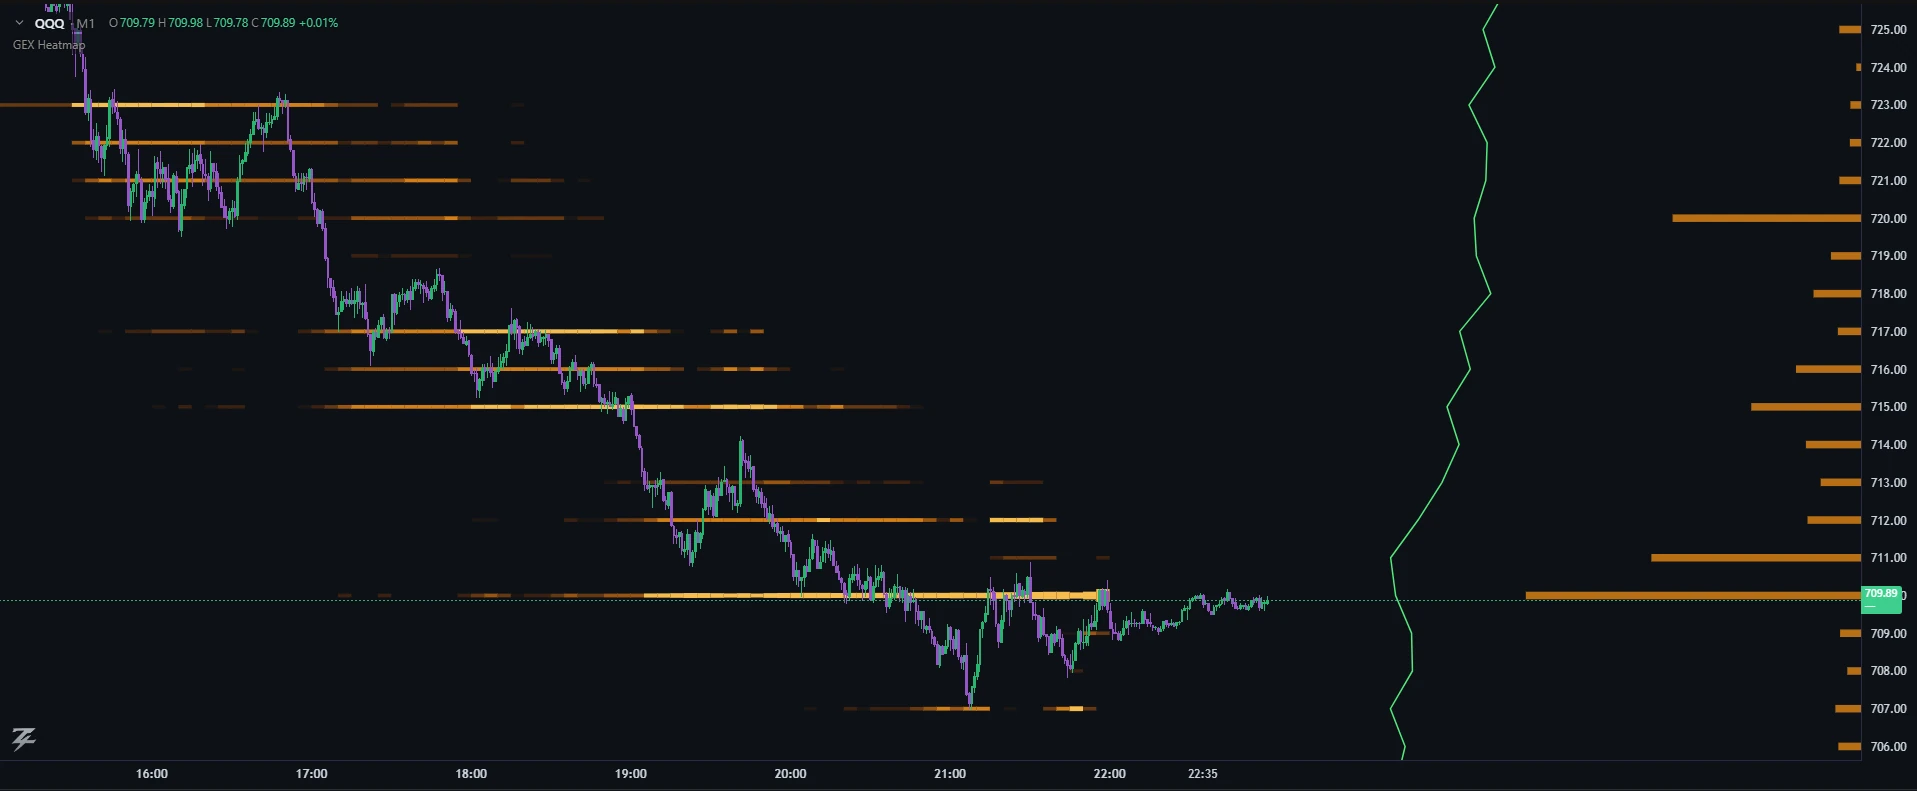
How to read it
- Start with colour at price. Is price inside cyan, inside orange, or between? That is today's regime in one glance.
- Then read the bright bands. The brightest bands near price are the levels with the most hedging pressure. Price tends to slow, wick and revert at bright cyan bands, and to accelerate through orange ones.
- Then read the lines. The Flip separates "calm above" from "fast below". The walls are the nearest boundaries of the expected range.
- Read the time axis. A band that grows brighter as price approaches means positioning is being added; one that fades means it is closing or expiring. Bands that were strong yesterday and vanished are no longer in play.
Typical situations
| You see | It tends to mean | What fits |
|---|---|---|
| Price in bright cyan, walls on both sides close together | Pinning / range day. Moves get absorbed. | Fade the edges back toward the middle; avoid chasing breakouts; expect slow drift into expiry. |
| Price just above the Flip, orange directly below | A thin floor. If it breaks, hedging flips from absorbing to chasing. | Respect the Flip as an invalidation; a clean close below it with fresh flow is the trend trigger. |
| Price below the Flip in orange territory | Expansion regime: bigger candles, extended trends, overshoots. | Trade with momentum; pullbacks into the Flip from below often act as resistance; don't fade strength. |
| Price approaching a big call wall from below | Resistance zone; also a magnet if the wall is large. | Watch for stalling and wicks; a decisive close above with call buying often means the wall is giving way. |
| One very bright strike far from price | A level that matters more near expiry than now. | Note it; it becomes relevant if price drifts toward it late in the week. |
Greek Ladder
The Greek Ladder is a table on the right edge of the chart: one row per strike (lined up with the price axis, so it follows you when you scroll or zoom) and one column per expiry, with a Σ column that adds them up. It answers "where, and in which expiry, is the hedging pressure?" — the GEX heatmap shows how it changed over time, the ladder shows the live picture by expiry.
- Metric — GEX, charm, delta, open interest, or call − put open interest. Cyan is positive, orange is negative; brighter means stronger within that column.
- Expiries shown and column width — fewer, narrower columns leave more room for candles. On a narrow window the table shrinks on its own and never takes more than half the chart.
- Colour scale — "Per expiry" gives each column its own peak, so far expiries are not drowned out by 0DTE; "Whole table" uses one shared peak.
- Live only: it recalculates from the latest open interest and the running chart price, so there is no history. Free on BTC, ETH, gold and silver; ETF and index ladders (SPY, QQQ, GLD, SPX) need a paid plan or the trial.
Settings that matter
- Scope — which expiries count:
wdte(this week),mdte(this month),all. Day traders:wdte. Swing traders:mdteorall. - Metric —
gex(gamma pressure, the default),dex(directional hedge),oi(where contracts are stacked). - Intensity bar — raise the low end to hide weak cells. If everything looks bright, raise it; if nothing shows, lower it.
- Components — turn the heatmap, Flip, walls, Max pain and strike profile on or off separately to declutter.
GEX is a model of dealer positioning, so treat levels as zones, not exact prices. Levels shift as the day goes on — re-check after big moves.