
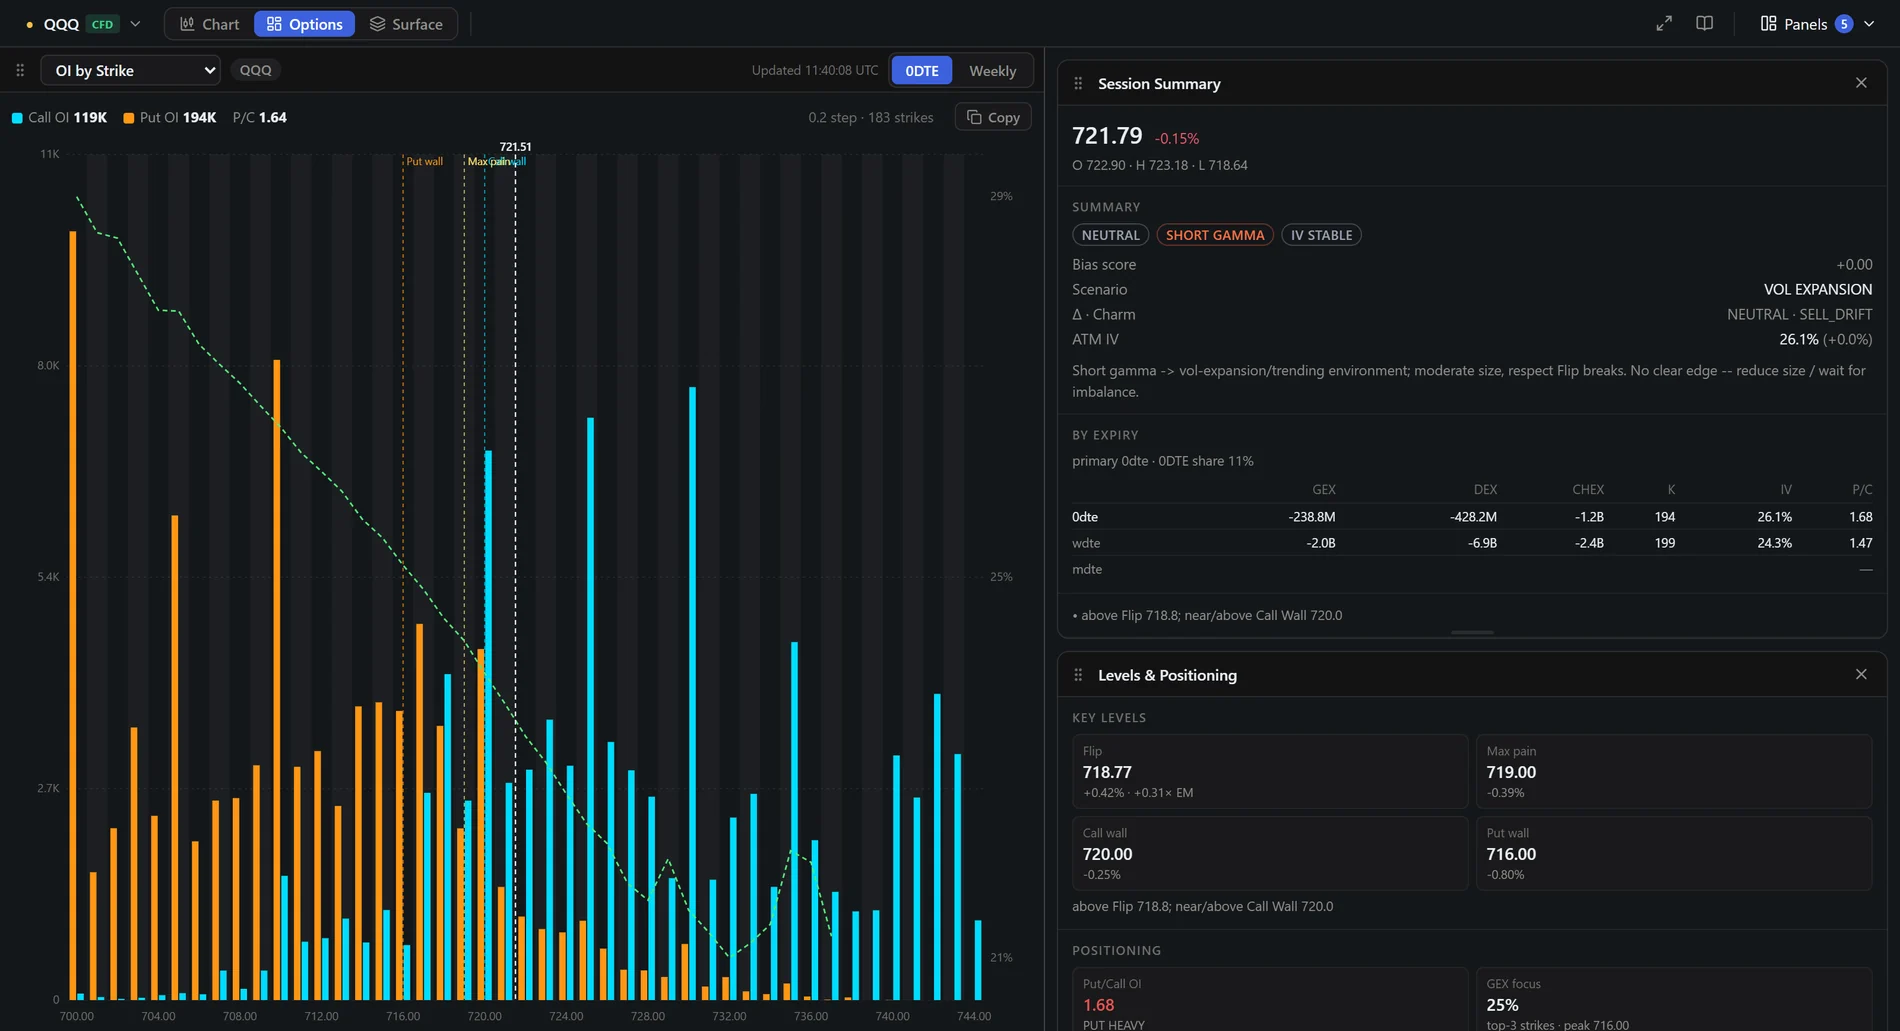
A desk for options analysis with no chart. Switch the top bar from Chart to Options and the candles give way to the panels that answer one question: where is the positioning, and what is trading against it? Use it before the session to build the map, or any time you want the numbers behind the picture without the price chart in the way.
Switching and choosing panels
- The Chart | Options switch sits at the top left of the top bar. Your choice is remembered.
- In the Options workspace the Widgets menu becomes Panels. It has its own list, so the panels you open here do not change the chart view.
- The symbol picker works as usual: pick BTC, ETH, GLD, SPY or QQQ and the panels follow.
Main panel and cards
- The main panel on the left takes about half of the screen. Drag the divider between it and the cards to make it wider or narrower. Use the drop-down at its top to choose which panel is the main one.
- The cards on the right stack in the order you set. Drag a card by its grip to reorder it, or drop it on the main panel to swap them. Drag the bottom edge of a card to change its height.
- Sizes and order are remembered in your browser. Panels that need little room fit their content on their own.
OI by Strike
Call open interest (cyan) and put open interest (orange) side by side on every strike, with the spot price, the call and put walls, max pain and the implied-volatility curve over the bars.
- 0DTE | Weekly in the panel header switches the expiry scope. It follows the same scope as the GEX heatmap.
- P/C next to the totals is the put/call open-interest ratio for the scope you picked.
- Copy puts the strike table on your clipboard as tab-separated text, ready to paste into a spreadsheet.
- Read the walls first. The tallest cyan bars above spot and the tallest orange bars below it are where positioning is thickest. They usually line up with the GEX walls; where they do not, ask why.
- Compare the two scopes. A strike that is heavy in 0DTE matters today; one that is heavy only in Weekly is a slower magnet.
- Watch the IV curve. A steep rise on one side means the market is paying up for that direction.
Volume by Strike
Call and put contracts traded on every strike, as opposed to open interest, which is what is held. Choose Intraday (today so far) or End of day (the last full session). A strike with a large volume and a small open interest is where today's new activity is; a strike with a large open interest and no volume is old positioning.
The session panels
- Session Summary — last price and day range, bias, gamma regime, scenario, ATM IV and the GEX / DEX / CHEX table for each expiry scope.
- Levels & Positioning — Flip, max pain and the walls with their distance from price, put/call open interest, OI walls and OI changes, and the zones where several levels stack up.
- Expected Move — today's ±1σ band from ATM IV against the day's actual range.
- Volatility — IV rank, realised versus implied, term structure and skew.
- Options Tape — today's bullish versus bearish premium and the biggest print, plus a live table of prints. Filter by minimum premium or minimum size. The columns are time, type (LC = long call, SC = short call, LP = long put, SP = short put), strike, expiry, size, premium and flags; price and IV appear when the panel is wide enough.
- Block Trades, Liquidations, GEX Profile and Replay work as described in their own chapters.
What is free
On the Free plan the workspace opens with OI by Strike and GEX Profile, with data delayed by 24 hours. The other panels need the trial or a plan; they show a lock until then. See Free plan, trial and plans.
Open interest updates once a day, so OI by Strike does not change during the session; the volume panels, the tape and the regime numbers are what move. On Gold, S&P 500 and Nasdaq the numbers come from ETF options converted to the index, and the buy/sell side on the tape is estimated.